The term "trend", derived from the English word trend ("trend", "main direction"), means a pronounced increase or decrease in the price of a financial instrument. The trend can be bullish or bearish. In the article, we will examine what the “bullish trend” means and analyze other concepts that are appealing on the exchange.
Getting to know the terms
Bullish trend (or bullish movement, bullish movement) - this is how the direction of the price growth of a trading pair has been called for a long time in the markets, similar to how bulls raise their horns.
The price rises when most traders buy, not sell.
“Bearish trend” or “bearish movement”, “bearish movement” - this expression refers to a fall in the price of a particular trading pair, most likely, by analogy with the way a bear hits with a heavy paw from top to bottom.
A bearish trend forms when the majority sells in the market. In relation to the course of a trading pair, they say that it has a bearish focus, when it moves down, and, accordingly, bullish - when moving up.
Horizontal trend or flat
However, the bullish or bearish trend does not always prevail on the exchange. It happens when there is neither one nor the other. So, the situation when the market is standing and the price almost does not move either up or down, got the name "flat", from the English word "horizontal".
Names for purchases and sales have also taken root in the market. So, a position open for sale is called short, and a buy position is called long. If a trader opens an order for a long position, he hopes that the price will increase over time, and he will be able to close it profitably, at a more favorable price.
When an order for a short position is opened, the currency pair is supposed to fall.
Bullish and bearish trend - what is it? This is a stable trend in the market, talking about how the price will change in the long run: decrease or increase.
Trading on the "Forex", it is not at all required to constantly be "in the market." If the trader is not satisfied with the price, he may not open positions, but simply wait out the unfavorable period for him and enter when the price of the currency pair suits him.
Chart Trend Lines
It is believed that, in principle, you need to trade "on the trend." Among traders who trade, after conducting a technical analysis, there is a saying that the trend is a friend of the trader. Rarely do any experienced market traders run the risk of entering the market without analysis. And most relies precisely on the technical.
There are many diverse trading strategies, but it is believed that the most profit is generated by trend trading.

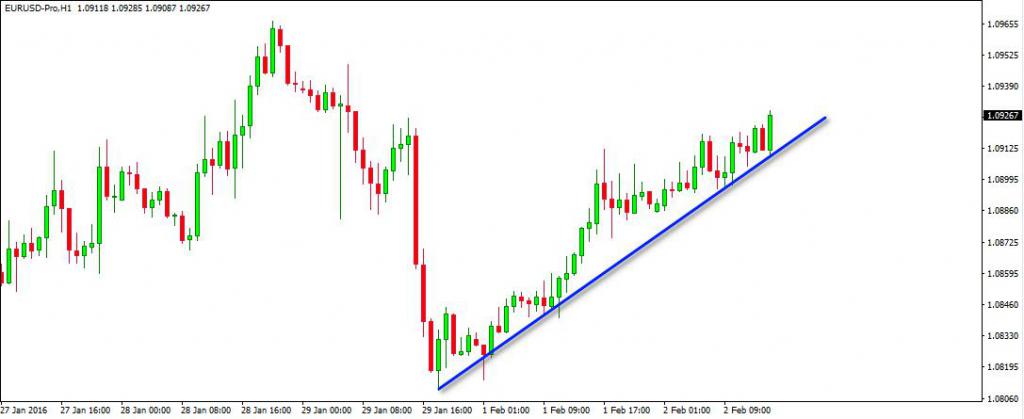
For analysts of the trading situation, they build trend lines on graphs.
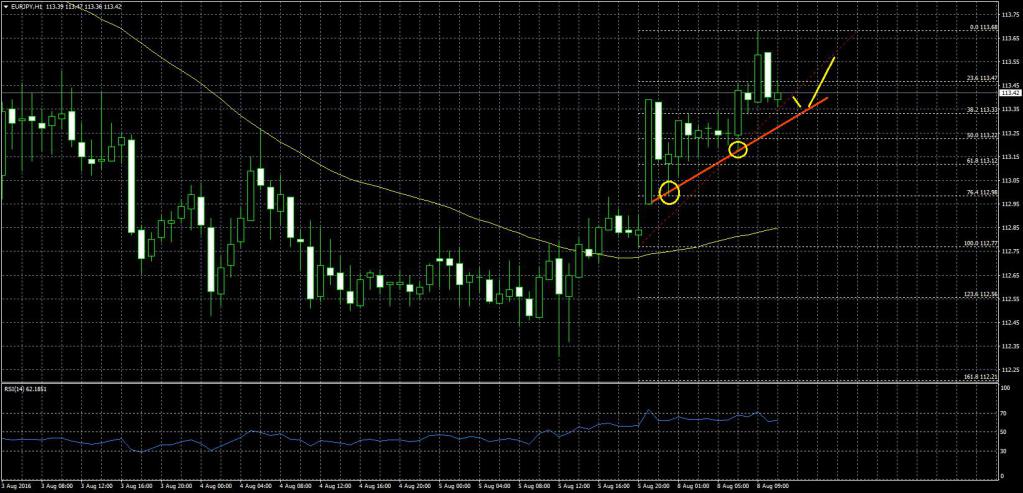
For a bullish trend, a line is built along two adjacent lows. The likelihood that the existing trend will not change in the near future and will be strong is higher, the more clearly expressed these lows and the more traders see in them a sign of rising prices. The higher the timeframe of the chart on which the trend is being viewed, the stronger the bullish trend should be expected.
Plotting a trend line
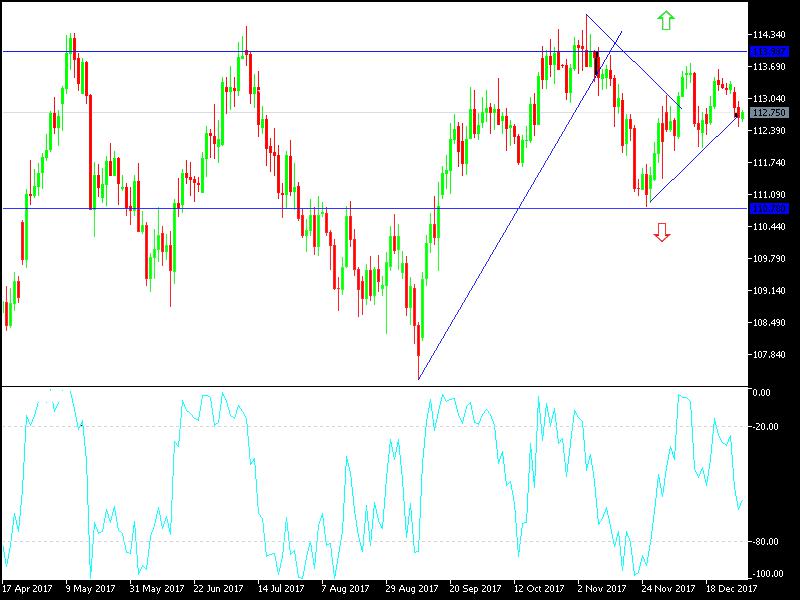
It is noteworthy that from the same points on the chart, you can build not one, but several trend lines:
- For example, if you look at the chart with the annual timeframe, you can see that a few years ago, a certain currency pair formed an uptrend. This became apparent after the appearance of the second minimum point on the chart.
- Then the figurative currency pair continued its growth, forming the second trend. She, too, soon struck.
- After a minor correction, the course began to grow again, and the third trend line appeared, which then was also broken.
- After that, the price returned to the same mark with which the first trend line began and remained near it.
Thus, several trend lines passed through one point, but this is in a rather long time period. In the example, attention should be paid to the fact that the pair’s course constantly tried to return to the initial mark at all breakouts, which means that the bullish trend is quite powerful and most likely will remain for some time.
A downward (bearish) trend is being built in the same way. It is being built on a pair of clear highs on the chart.
For example, if two clearly trending trends are visible on the chart, one of which is the support level for a trading pair, then after breaking through the first one, further adjustment with a new maximum becomes possible.
After the trend lines are drawn on the chart, the trader himself can search for short-term and long-term trends, given the strategy by which he trades.
Why do traders need trends
Since most traders trade according to their chosen strategy, their work with trends will be different in certain conditions:
- if a trader uses trend signals as auxiliary signals when he is trading based on fundamental data;
- the trader uses the trend as confirmation of other trading signals when he trades according to a strategy based on technical analysis;
- trader trades on a trending strategy.
Trend Trading
If a trader is trading on a trending strategy, then he should pay attention to certain positions. These include:
- The depth of the correction of interest.
- Signs of a change in an existing trend or breakdowns of its line.
- Bounces from support and resistance lines, by which it is possible to predict the maintenance or reversal of a bullish trend or a downtrend.
False breaks of trend lines
Based on historical data, it would not be difficult to build trend lines. However, in practice, breakdowns are often false. For this reason, experienced traders insist that when opening any order, it is imperative to set a stop loss in order to minimize losses in case of failure. And if the trend change does not happen when the trader expects this, then the losses will not be fatal.
Over time, when a trader realizes that the trend has gone where he needed to, he has another task - to maximize profits from this transaction. This can be achieved by increasing the volume of an open order, when the bull trend is confirmed by a new minimum. Or when a fresh high gives confirmation of a bearish trend.
Thus, pursuing the goal of not losing too much and earning as much as possible, the trader has to constantly move the stop loss, placing it above a new high or a new minimum, after each confirmation of a trading trend.
The composition of trending strategies
In most cases, the composition of trend trading strategies is as follows:
- Constant comparison of trend lines on different chart timeframes. For example, when trading on the hourly timeframe, you should enter by the 15-minute one, and check the existing trend according to the daily chart.
- Signals of various technical indicators and oscillators, candlestick patterns that keep the trader from unreasonably opening orders at those moments when the price of the pair is near the trend line. It is far from always necessary to enter the market, and signals help to understand whether it is time to enter or is worth the wait.
It is recommended to trade using your own strategies, and use trading systems only with additional signals.For example, if market conditions develop in such a way that, according to the trading system, it is time to open a buy order, and the charts show a clear bearish trend, then you should refrain from entering the market until confirmation is received.
A similar situation is with fundamental analysis. When the good news comes out, during a bullish trend, the chances of a forecast being correct are much higher. However, it must be borne in mind that signals and trend lines are not the law. This means that a reversal of the bull trend may well occur.