Many Internet users are attracted by the opportunity to make money in the financial markets. Most of them consider this a fairly easy process. But in fact, in order to really make money through trading, you need to get specialized knowledge and get trained. However, the analytical forecast of the trader, on which the profitability of the deal depends, is not always true, and therefore, in trading, in some cases, the correlation of currency pairs is used.
The concept of correlation of trading assets
What is correlation? Probably, many newcomers have already come across this concept. Correlation of currency pairs is a kind of relationship that can be expressed not only between the monetary units of different countries in one asset, but also between trading instruments. Such a relationship can be traced in all directions of financial markets, and since it is precisely the currency pairs that are traded on Forex, it is between them. As a result of correlation, they interact with each other and affect the dynamics of each other.
Features of correlation in the foreign exchange market
Depending on the direction of financial markets, correlation can be traced in the form of a relationship between various trading assets. Two types of connections can be noted on the Forex market:
- Correlation between currencies.
- The relationship between currency pairs.
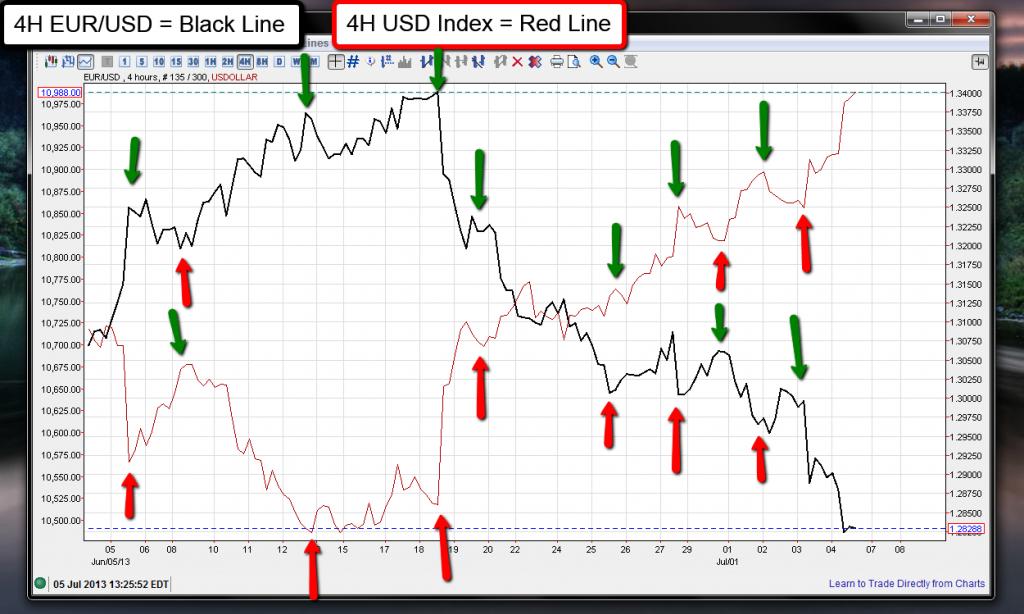
For a better understanding of this issue, the article will consider an example. Each Forex pair consists of two assets - this is the main currency and the quoted currency. For example, a pair of euro / dollar (EUR / USD), where the European currency is the base, that is, the main asset, and the American dollar is the quoted, that is, the dependent currency. If the euro rises, then the dollar quotes, respectively, fall, and vice versa.

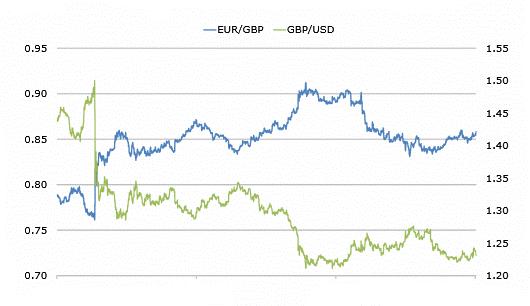
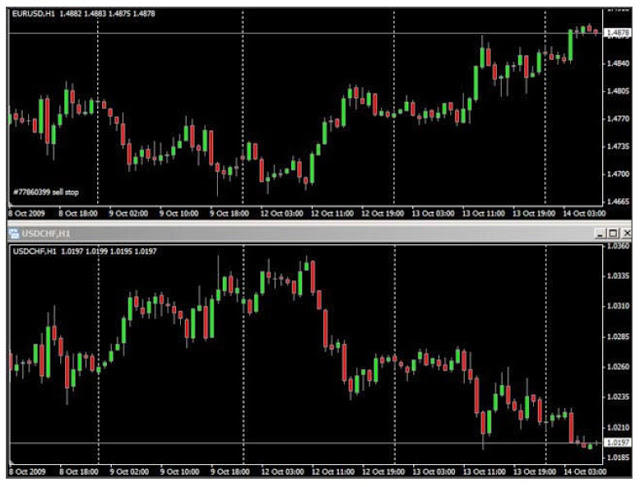
Similarly, the correlation of currency pairs. Suppose a pair of the European currency against the US dollar will correlate with the unidirectional asset of the British pound to the US dollar. As a result, if we compare them on one chart, we can clearly see that both assets are going in the same direction and have very small differences. This correlation of currency pairs is called direct.
Correlation between trading assets
However, not only at Forex these relationships can be traced, but also in any other areas of the financial market. On stock exchanges, speculators also use this pattern to reduce transaction risks.
In binary options, where not only currency pairs are used in trading, but also other assets, for example, stocks or metals, correlation is also quite widespread among traders. Based on it, specialized tools and trading strategies have been developed. The most sought-after trading asset is the correlation between gold and the US dollar. The basics are the same: if one instrument rises in price, then the other asset goes in the opposite direction.
Types of market correlations
In trading, any trading assets, including currency pairs, can have two types of correlations: direct and feedback.
- A direct or positive correlation is characterized by the movement of trading assets in one direction. This does not mean that they will completely copy each other. Of course, there will be errors between them, that is, one tool will move faster than another and thereby set the direction to movement. Quite often, a faster asset is used as a guide.
- Inverse or negative correlation is characterized by mirror movement.That is, assets are moving in different directions.
To understand what kind of relationship between the selected currency pairs or other trading assets, it is necessary to analyze their ratio.
Calculation of the correlation coefficient
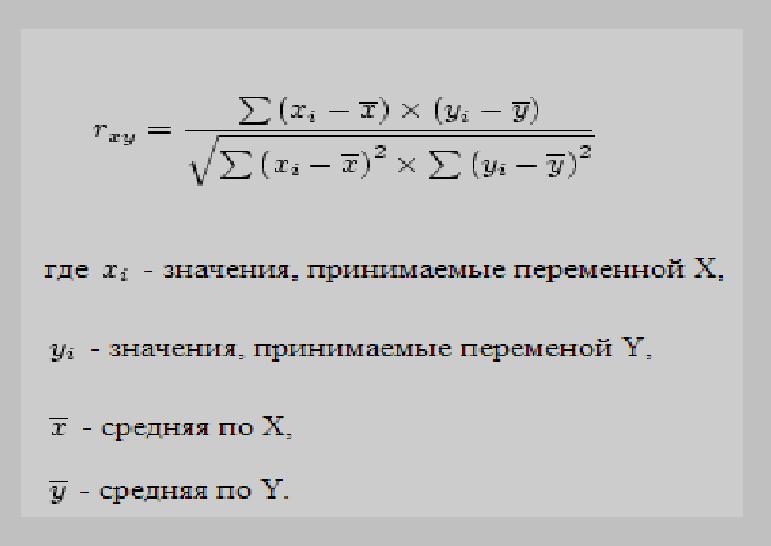
To calculate the correlation coefficient of currency pairs, you need to use the formula. After making simple mathematical calculations, substituting the necessary data, you can get the desired result value.
In trading, to facilitate such calculations and not to do them manually, you can use two options of tools:
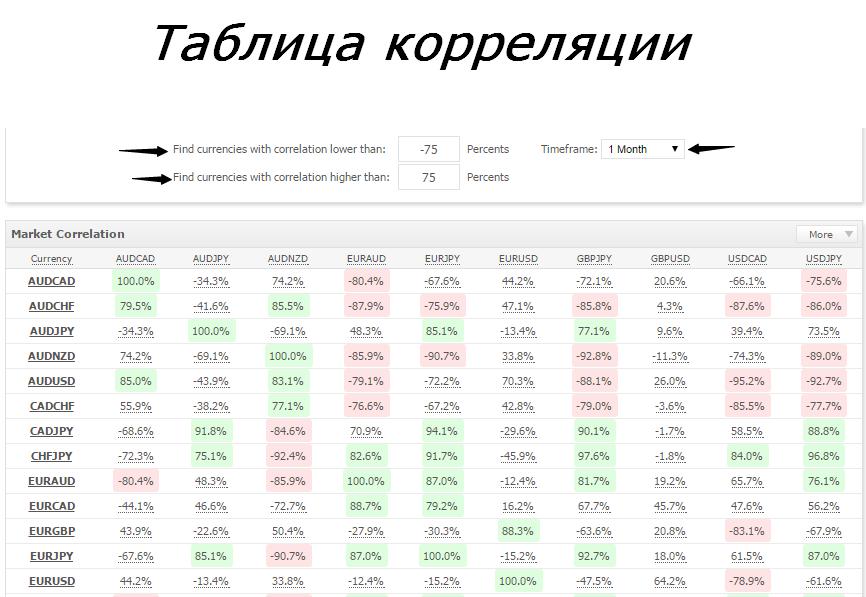
- Correlation table of currency pairs.
- An indicator for determining the correlation between assets.
The formula for calculations is presented in the figure, where the value of X is one currency pair, the value of Y is another asset. The result is a correlation coefficient. As mentioned above, it can have both positive and negative meanings.
Ratio score:
- From 0 to 0.4 is an insignificant correlation relationship.
- From 0.4 to 0.7 is the average level.
- From 0.9 to 1.0 is a strong bond.
Similarly, calculations are carried out with a negative correlation, only the values will have a minus sign. The strongest connection is on indicators 1 and -1 (positive and negative correlations).
Selection of related currency pairs
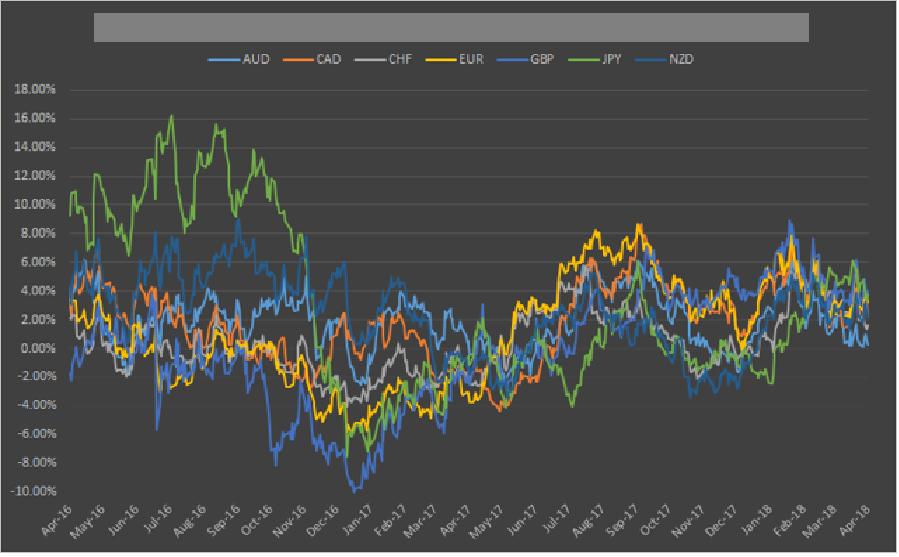
To make money in the financial market by correlation, you need to study this unique phenomenon. Experts noted that different currency pairs can have both the same direction and in opposite directions. It is the second option that is most attractive to traders. Reverse correlation currency pairs allow hedging transactions and trading in a safer mode. But a positive correlation can also be useful for a trader, especially when he knows which of the currency pairs is a guide, that is, a guide.
In trading, the correlation table is most often used to identify relationships between assets, rather than making independent calculations according to the formula. If a trader is going to use a direct type of correlation in trading, then it is necessary to select values that are as close as possible to unity. The sign must be positive. When using a negative relationship, that is, inverse or mirror correlation, you need to choose currency pairs that will have the closest possible values to minus one.
It should also be borne in mind that all communications can both strengthen and weaken during the trading day. If, for example, a very strong correlation is traced on the hourly chart of any trading asset, then on the 5-minute chart it may already weaken significantly. Therefore, when choosing trading assets, it is necessary to take into account the time range and working time frame.
Description of the trading strategy
In trading, professionals and experts have developed several types, probably even dozens, of currency pair correlation strategies. The most popular among traders was the method of hedging transactions. Negative correlation assets are suitable for this strategy. In addition to the strategies themselves in this area, special technical indicators have been developed to help traders, which will be discussed later in the article.
Trading Rules:
- Choose trading pairs, the discrepancy between which is as close as possible to minus one. For this, a correlation table is used.
- Next, you need to conduct an analytical forecast of market movement in order to understand which way assets will move.
- Then you need to carry out the calculation on the chart to calculate the largest discrepancy between the trading pairs. It is best to use historical quotes on higher timeframes for these purposes.
- Set two selected trading assets on one chart at once. This can be done using a technical indicator.
- After crossing the movement of currency pairs, two transactions are simultaneously opened - for purchase and for sale. That is, one asset must be opened to increase market quotes, and the other to lower prices.
- The inverse correlation of currency pairs, despite the fact that assets will go in different directions, still implies the installation of protective orders - “Stop-loss”. They need to be installed on each currency pair with a value of 15 points.
- Each trader sets a profit-taking Take Profit order independently, depending on his goals and historical data. And also special attention should be paid to the market situation. With strong movements, values are set larger than with weak pulses.
Closing positions is carried out simultaneously, upon reaching the desired profit. In most cases, traders use the Fibonacci indicator or support and resistance levels.
Indicators for trading
For the convenience of traders, specialists have developed special technical indicators for correlation of currency pairs. They have 2 categories:
- The first option is to set the selected currency pairs on one chart.
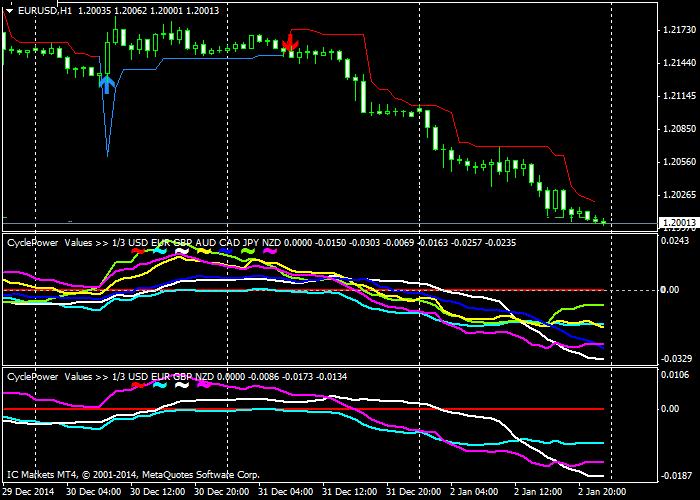
- The second option is to set the indicator in a separate window below, under the chart of market quotes.
The most convenient tools are indicators from the first category, as they visually facilitate the analysis of assets and clearly show the divergence of currency pairs. An example is Correlation Between Symbols, which is specifically designed for the MetaTrader terminal.
The following correlation indicators are also very popular among users:
- OverLayChart;
- IND_Correlation.
Conclusion
The method of correlation of currency pairs is widely used by traders. With its proper application, after some practice, you can get stable positive statistics on transactions. Inverse proportional correlation allows minimizing financial risks, as the strategy uses the hedging method of transactions. These are fairly simple and understandable ways of trading, and even beginners can use them in their work.