Profit reflects the efficiency of the enterprise, its liquidity and solvency. It affects the pace of modernization of production. Therefore, it is important to be able to calculate and analyze this indicator.
Definition
Any activity is aimed at generating income that covers losses and brings profit. It is important to be able to distinguish between these concepts. The money received from the sale is called revenue. Net income is the amount that remains after all expenses are paid. That is, profit is the difference between revenue and costs. But this term is much broader. The net profit formula includes the final financial result of various activities.
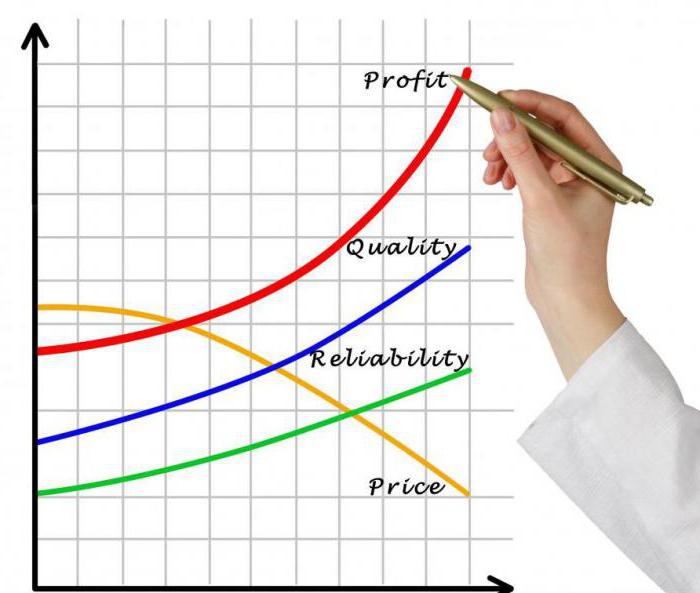
An organization can receive income only by producing competitive products. Of great importance is the price. It must match the solvency of potential consumers. The company sets prices depending on the level of costs. If the amount of resources consumed is less than the proceeds received, then the organization operates with a profit. In a market economy, unprofitable enterprises do not exist for a long time.
Net profit, equity are sources of self-financing of the organization. Maximization of income is an important condition for the prosperity of the enterprise and the country's economy. An enterprise can channel profits to scale up, strengthen its position, and update its operating system.
Functions
- Profit displays the result of an activity.
- Stimulating: income maximization affects the growth of salaries, the rate of updating the OS, raising the level of production.
- Fiscal: at the expense of the income of enterprises, taxes are paid and budgets are formed.
- Estimated: the amount of profit directly proportional to the value of the organization.
- Control: losses incurred indicate a large amount of expenses.

Structure
The net profit formula includes income from sales, operations with fixed assets, results of financial and non-operating activities. The first indicator is of the utmost importance. The organization is not able to influence the level of stock quotes, on which the result of operations with securities depends. But it can reduce costs and increase revenue.
There are other criteria by which the net profit of an organization is classified:
- depending on the calculation method: marginal, net, gross;
- by the nature of the payment of fees: taxable and non-taxable;
- by time: profit of previous years, reporting and planning period;
- by the nature of application: capitalized and distributed.
To calculate each of these indicators uses its own formula.
Factors
An organization may itself influence profits. The level of technology used, capacity utilization and other production factors affect the quantity and quality of products. It is more difficult to regulate non-production factors: the interaction of employees of different levels of the hierarchy, the reaction of personnel to changing working conditions, logistics, etc. affect the market conditions, inflation and taxation, monetary policy, remoteness from resources, and the enterprise cannot influence it at all. But these external factors have an indirect effect on the activities of enterprises. Therefore, it is so important to be able to assess the degree of influence of each criterion on net income.
To maximize profits, it is necessary to analyze the range of products. Products that are practically not in demand, excluded from circulation.An effective management system for market segmentation should also be developed, and automated systems and non-waste production systems should be introduced.
Income and costs
From an economic point of view, profit is the difference between receipts and payments. From economic - the difference between the state of the enterprise at the end and beginning of the period. In this regard, distinguish accounting and economic profit. The relationship between the categories is expressed in their formulas:
- Accounting profit is the difference between total income and clear costs.
- Economic profit is the difference between income and all costs.
Thus, we obtain: economic profit = accounting profit - implicit costs.
Explicit costs are the sum of the costs of paying for resources: raw materials, machinery, labor, etc. Implicit costs are the cost of the firm’s internal resources. For example, an enterprise uses its own building for business activities. Utility costs in this case are obvious costs. They can be documented. Implicit costs in this case are lost revenue from renting a building.
Profit calculation
As noted earlier, revenue is a general measure of profitability. Its volume is determined by adding the sums of expenditure invoices. It is calculated as payment is received or as goods are shipped. Excluded from revenue are VAT, excise taxes, mark-ups received by merchants, and export tariffs.
1. Net profit from sales (CZ) = Revenue - VAT - Excise taxes - Export tariffs.
2. Gross profit - this is the difference between net income and cost: Bp = CZ - Cost.
3. Profit from sales (Ppr) = VP - Ur - Cr, where:
- Ur - management costs.
- Cr - business expenses.
4. Net income from all types of activities: Po = VP + IP + FP + PD, where:
IP, FP and PD - income from investment, financial, other activities.
5. Profit before tax (Mon) is the final result identified after accounting for all transactions.
Mon = Po - Real estate tax - Income benefits.
After paying all fees, the organization has money that can be spent on its own needs.
Net profit formula: PE = Po - NPP + PD - Pr, where:
- NPP - income tax.
- Pr - other expenses.
Marginal revenue, or “zero profit”, is the amount of revenue that covers all costs.
Analysis
Research is conducted in order to evaluate the results of activities, to develop measures to reduce costs, increase revenue. Most often, factor analysis is used, which shows the degree of influence of individual indicators on the final result. For example, when considering gross income, ways to reduce costs are explored. Profit calculation is based on data from the balance sheet and form No. 2 of the “Report on financial results”.

Analysis Objectives:
- assessment of the profitability of a business plan;
- determination of the influence of factors on the deviation of actual profit from planned;
- identification of growth reserves.
Directions of analysis:
- horizontal - the study of the dynamics of the values of indicators;
- vertical - study of the structure of indicators;
- factor - identifying sources of profit growth;
- profitability assessment.
Formation
It is very important to be able to draw up a planned balance of income and expenses. If you correctly plan all the stages, from product launch to cash flow, you can predict the future work of the organization. At the planning stage, you need:
- to study the need for additional fundraising;
- identify priority areas for the use of resources;
- to develop ways to increase the profitability of production;
- calculate the threshold of minimum profit in order to quickly respond to changes in activity.
Sources of profit formation affect its volume. If there is an increase in production and a simultaneous decrease in cost, this indicates a high "quality" of sources of income. Rising prices with constant production volumes indicate the opposite.

One of the indicators that is calculated in the analysis of profit is the breakeven point. It displays the volume of production in units or rubles, at which the amount of revenue will cover costs.
If the first indicator is less than critical, the company will incur losses.
Factor analysis of net profit
The study compares indicators for the reporting (1) and last (0) year. Let us consider in more detail all the stages.
- We determine the dynamics of profit: PE = PE1– PE0.
- We calculate the increase in sales: B% = (B1.0 / B0) x 100 - 100. This formula uses the revenue of the reporting period in prices of the previous year.
- The impact of sales dynamics on profit: PE1 = (PP0 x V%): 100.
- The effect of changes in profit prices: PE1 = (B1 - B0): 100.
- The influence of the dynamics of cost: PE1 = (C: C1 - C: C0): 100. The calculation is carried out, both as a whole for the total amount of costs, and separately in the context of production, commercial and administrative expenses.
The influence of the dynamics of the sales structure is defined as the difference between the total change in the indicator (1) and the magnitude of the influence of the other three (2, 3, 4).

Example
For convenience, we placed the initial data in a table.
| Name of indicator | The value of the indicator, rub. | ||
| For the previous year (basis) | Actual volume expressed in base prices | For the reporting year | |
| Revenue | 43 000 | 32 000 | 41 000 |
| Cost price | 31 000 | 22 000 | 32 000 |
| Selling costs | 5 600 | 4 700 | 6 300 |
| Administrative expenses | 1000 | 650 | 900 |
| Total cost | 37 600 | 27 350 | 39 200 |
| Profit Loss) | 5 400 | 4 650 | 1 800 |
In this example, a simplified net profit formula is used: PE = Revenue - Cost.
We carry out factor analysis.
Change in profit: 1,800 - 5,400 = -3,600 thousand rubles.
Change in sales: (32,000: 43,000) x 100 - 100 = -25.58%.
(5400 x (-25.82)): 100 = - 1394.28 thousand rubles.
The influence of price dynamics: 41,000 - 32,000 = 9,000 thousand rubles.
The impact of cost: 27 350 - 39 200 = - 11 850 thousand rubles.
Conclusion: for the reporting period, the net profit of the organization decreased by 3.6 million rubles. Due to revenue, revenue decreased by 25.58%, that is, by 1394.28 thousand rubles. The negative impact also had an increase in cost. Price increase of 9 million rubles. could not compensate for the decrease in income due to an increase in costs by 11.85 million rubles.
Taxation
The organization is required to pay tax quarterly. Its value is determined by subtracting benefits from the total profit (% on debts, advertising costs, transportation costs, etc.), tax rebates. NPP is charged proportionally at a rate of 20%. Funds are allocated to replenish the state budget.
BOO
The net profit indicator is reflected in account 99. Depending on the outcome of the transaction, the amount is carried out according to DT or CT:
- DT90 (91) KT99 - profit from the results of the main (non-core) activity.
- DT99 KT90 (91) - loss is reflected.
- DT99 KT94 - Deducted net profit for the year.
Efficiency
Profitability is relative indicator which displays the quality of asset use. It is calculated by dividing income by the value of resources.
Profitability = BP / (OF + OA), where:
- BP - profit before tax (balance sheet).
- PF - the average price of the production fund (total І section of assets).
- OA - the average price of current assets (total of the II section of assets).
Other indicators are also used to analyze the activity.
- Profitability of sales is the ratio of net profit from sales and revenue. The normative value for an industrial enterprise is up to 0.4, for a trade organization - up to 0.3.
- Return on assets is the ratio of net profit to assets (total І section of the balance). The indicator displays the efficiency of the use of property. Favorable is the situation when net profit is growing, assets (current assets) are updated. The standard value of the indicator for an industrial company is 0.1, for a trading company - 0.05.
- Return on investment is the ratio of net income to the organization’s own funds. The standard value of the indicator for an industrial enterprise is 0.16, for a company - 0.07.
- AO profitability is the ratio of net income to current assets. The higher the value of the indicator, the more efficiently the funds are used. Standard values: 0.02 and 0.08.
- Return on equity reflects the return on investment. Standard values: 0.02 and 0.06.

Example
Current period data:
- The actual cost of OA is 53 thousand rubles.
- NMA - 1 thousand rubles.
- OS - 154.3 thousand rubles.
- Net profit - 20 thousand rubles.
Historical data:
- The cost of OA is 50 thousand rubles.
- NMA - 150 thousand rubles.
The total value of assets is: 154.3 + 1 + 53 = 208.3 thousand rubles.
For the year, net income increased by 8.3 thousand rubles.
Business profitability = 20: 208.3 = 9.6%.
Asset utilization efficiency: 20: 154.3 = 12.96%.
AO use efficiency: 20: 53 = 37.74%.