
Online analytical processing, or OLAP, is an effective data processing technology, as a result of which, based on huge arrays of all kinds of data, the final information is displayed. This is a powerful product that helps to access, retrieve and view information on a PC, analyzing it from different points of view.
OLAP is a tool that provides a strategic position for long-term planning and considers the basic information of operational data for a perspective of 5, 10 or more years. Data is stored in the database with the dimension, which is their attribute. Users can view the same data set with different attributes, depending on the purpose of the analysis.
OLAP History
OLAP is not a new concept and has been used for decades. In fact, the origin of technology has been traced back to 1962. But the term was coined only in 1993 by database author Ted Coddom, who also set 12 rules for the product. As in many other applications, the concept has undergone several stages of evolution.
The history of OLAP technology itself dates back to 1970, when Express information resources and the first Olap server were released. They were acquired by Oracle in 1995 and subsequently became the basis of the online analytical processing of the multidimensional computing mechanism that the renowned computer brand provided in its database. In 1992, another well-known online analytical processing product Essbase was released by Arbor Software (acquired by Oracle in 2007).
In 1998, Microsoft released the online analysis data processing server, MS Analysis Services. This contributed to the popularity of technology and prompted the development of other products. Today, there are several world-renowned suppliers offering Olap-applications, including IBM, SAS, SAP, Essbase, Microsoft, Oracle, IcCube.
Online Analytical Processing
OLAP is a tool that allows you to make decisions about planned events. Atypical Olap calculation can be more complicated than just aggregating data. Analytical Queries per Minute (AQM) is used as a standard reference for comparing the performance of different instruments. These systems should hide users as much as possible from the syntax of complex queries and provide a consistent response time for everyone (no matter how complicated they are).
The following key features of OLAP exist:
- Multidimensional data representations.
- Support for complex computing.
- Temporary intelligence.
Multidimensional presentation provides the basis for analytical processing through flexible access to corporate data. It allows users to analyze data in any dimension and at any level of aggregation.
Support for complex computing is the foundation of OLAP software.
Temporary intelligence is used to evaluate the effectiveness of any analytical application over a specific period of time. For example, this month compared to the previous month, this month compared to the same month last year.
Multidimensional data structure
One of the main characteristics of online analytical processing is the multidimensional data structure. A cube can have several dimensions. Thanks to this model, the entire process of OLAP intelligent analysis is simple for managers and executives, since the objects represented in the cells are real-world business objects. In addition, this data model allows users to process not only structured arrays, but also unstructured and semi-structured ones.All this makes them especially popular for data analysis and BI applications.
Key Features of OLAP Systems:
- Use multidimensional data analysis methods.
- Provide advanced database support.
- Create easy-to-use end-user interfaces.
- Support client / server architecture.
One of the main components of OLAP concepts is a client-side server. In addition to aggregating and pre-processing data from a relational database, it provides advanced calculation and recording parameters, additional functions, basic advanced query capabilities and other functions.
Depending on the sample application selected by the user, various data models and tools are available, including real-time alerts, a function for applying what-if scenarios, optimization, and complex OLAP reports.
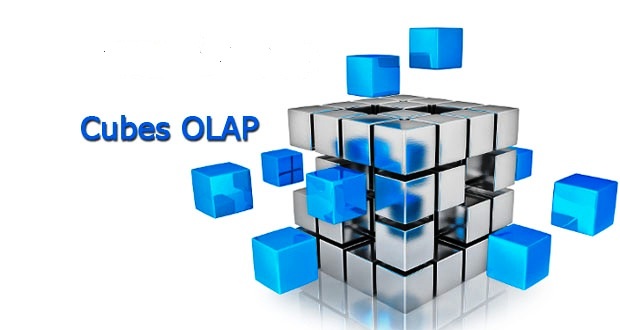
Cubic shape
The concept is based on a cubic shape. The location of the data in it shows how OLAP adheres to the principle of multivariate analysis, as a result of which a data structure is created for quick and efficient analysis.
An OLAP cube is also called a "hypercube." It is described as consisting of numerical facts (measures), classified by facets (dimensions). Dimensions relate to attributes that define a business problem. Simply put, a dimension is a label that describes a measure. For example, in sales reports, the measure will be sales volume, and dimensions will include the period of sales, sellers, a product or service, and the region of sales. In the reporting of production operations, the measure may be total production costs and units of output. Dimensions will be the date or time of production, the production phase or phase, even the workers involved in the production process.
The OLAP data cube is the cornerstone of the system. The data in the cube is organized using either a star or snowflake pattern. In the center there is a fact table containing aggregates (measures). It is associated with a series of measurement tables containing information about measures. Dimensions describe how these measures can be analyzed. If a cube contains more than three dimensions, it is often called a hypercube.
One of the main functions belonging to the cube is its static nature, which implies that the cube cannot be changed after its development. Therefore, the process of building a cube and setting up a data model is a crucial step towards appropriate data processing in the OLAP architecture.
Data aggregation
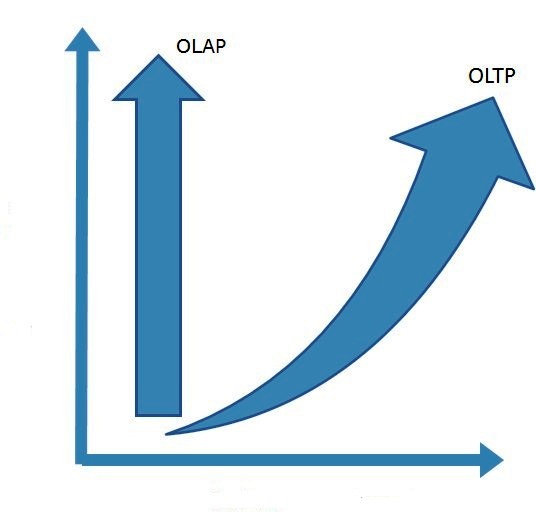
The use of aggregations is the main reason why requests are processed much faster in OLAP tools (compared to OLTP). Aggregations are summaries of data that were previously calculated during processing. All members stored in OLAP dimension tables define the queries that the cube can receive.
In a cube, information accumulations are stored in cells, the coordinates of which are specified by specific sizes. The number of aggregates that a cube can contain depends on all possible combinations of dimension elements. Therefore, a typical cube in an application can contain an extremely large number of aggregates. A preliminary calculation will be performed only for key aggregates that are distributed throughout the analytic cube of online analytics. This will significantly reduce the time required to determine any aggregations when executing a query in a data model.
There are also two options related to aggregations with which you can improve the performance of a finished cube: create an aggregation of the capabilities cache and use aggregation based on an analysis of user requests.
Principle of operation
Typically, the analysis of operational information obtained from transactions can be performed using a simple spreadsheet (data values are presented in rows and columns). This is good given the two-dimensional nature of the data. In the case of OLAP, there are differences due to the multidimensional data array.Because they are often obtained from different sources, a spreadsheet may not always be able to process them efficiently.
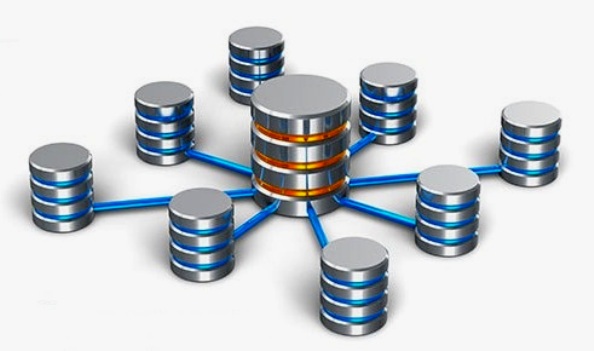
The cube solves this problem and also ensures that the OLAP data warehouse operates in a logical and orderly manner. The business collects data from numerous sources and is presented in various formats such as text files, multimedia files, Excel spreadsheets, Access databases and even OLTP databases.
All data is collected in a repository filled directly from sources. In it, the raw information received from OLTP and other sources will be cleared of any erroneous, incomplete and inconsistent transactions.
After cleaning and conversion, the information will be stored in a relational database. Then it will be uploaded to the multidimensional OLAP server (or Olap cube) for analysis. End users responsible for business applications, data mining and other business operations will gain access to the information they need from the Olap cube.
Array Model Benefits
OLAP is a tool that provides fast query performance, which is achieved through optimized storage, multidimensional indexing, and caching, which are significant advantages of the system. In addition, the advantages are:
- Smaller data on disk.
- Automated calculation of aggregates of a higher level of data.
- Array models provide natural indexing.
- Efficient data retrieval is achieved through pre-structuring.
- Compact for low dimensional datasets.
The disadvantages of OLAP include the fact that some solutions (processing step) can be quite lengthy, especially with large amounts of information. This is usually corrected by performing only incremental processing (data that has been modified is studied).
Basic analytical operations
Convolution (roll-up / drill-up) is also known as “consolidation”. Coagulation involves collecting all the data that can be obtained, and calculating all in one or more dimensions. Most often, this may require the application of a mathematical formula. As an OLAP example, we can consider a retail network with outlets in different cities. To identify models and anticipate future sales trends, data about them from all points is “collapsed” into the main sales department of the company for consolidation and calculation.
Disclosure (drill-down). This is the opposite of coagulation. The process starts with a large data set and then breaks up into smaller parts, thereby allowing users to view details. In the retail network example, the analyst will analyze sales data and look at individual brands or products that are considered best sellers in each of the outlets in different cities.
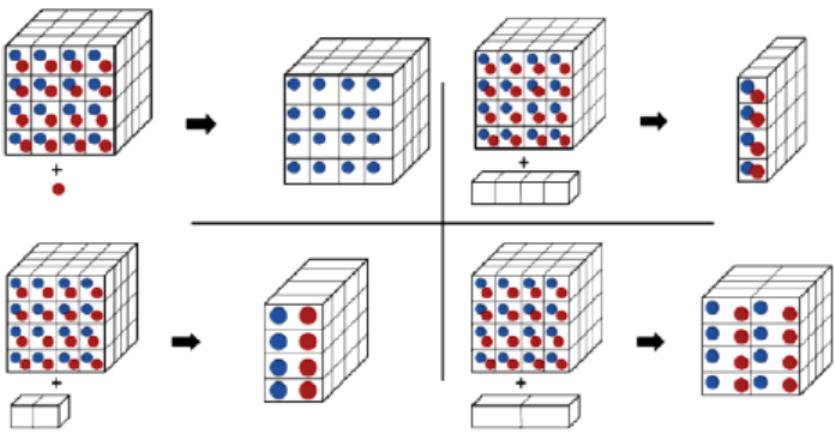
Section (Slice and dice). This is a process when analytical operations include two actions: derive a specific data set from the OLAP cube (“cutting” the analysis aspect) and view it from different points of view or angles. This can happen when all the data of the outlets is received and entered into the hypercube. The analyst cuts out the sales data set from OLAP Cube. It will then be viewed when analyzing the sales of individual units in each region. At this time, other users may focus on evaluating the cost-effectiveness of sales or evaluating the effectiveness of a marketing and advertising campaign.
Turn (Pivot). The data axes are rotated in it to provide a replacement for the presentation of information.
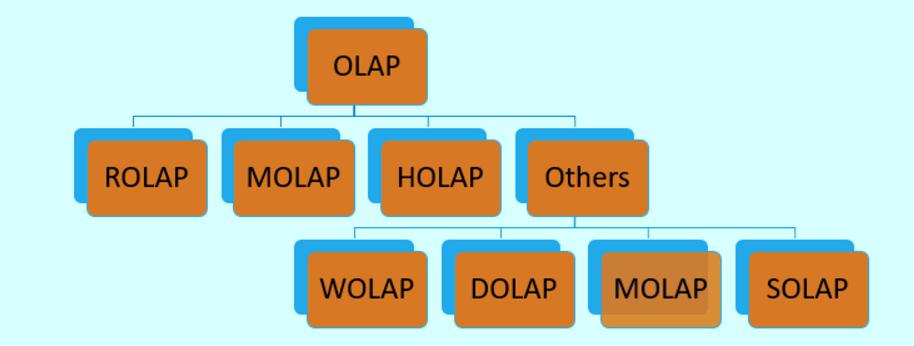
Varieties of databases
In principle, this is a typical OLAP cube that implements analytical processing of multidimensional data using the OLAP Cube or any data cube so that the analytical process can add dimensions as needed. Any information uploaded to a multidimensional database will be stored or archived and can be called up when needed.
| OLAP Type | Value |
| Relational OLAP (ROLAP) | ROLAP is an advanced DBMS along with multidimensional data mapping to perform standard relational operations |
| Multidimensional OLAP (MOLAP) | MOLAP - implements work in multidimensional data |
| Hybrid Online Analytical Processing (HOLAP) | In the HOLAP approach, aggregated totals are stored in a multidimensional database, and detailed information is stored in a relational database. This ensures both the efficiency of the ROLAP model and the performance of the MOLAP model. |
| OLAP Desktop (DOLAP) | In Desktop OLAP, the user downloads part of the data from the database locally or to his desktop and analyzes it. DOLAP is relatively cheaper to deploy because it offers very little functionality compared to other OLAP systems |
| Web OLAP (WOLAP) | Web OLAP is an OLAP system accessible through a web browser. WOLAP is a three-tier architecture. It consists of three components: client, middleware and database server |
| Mobile OLAP | Mobile OLAP Helps Users Receive and Analyze OLAP Data Using Their Mobile Devices |
| Spatial OLAP | SOLAP is created to facilitate the management of both spatial and non-spatial data in a geographic information system (GIS) |
Less well-known OLAP systems or technologies exist, but these are the main ones that are currently used by large corporations, business structures, and even the government.
OLAP Tools
Tools for online analytical processing are very well presented on the Internet in the form of both paid and free versions.
The most popular of them:
- Dundas BI from Dundas Data Visualization is a browser-based platform for business intelligence and data visualization, which includes integrated dashboards, OLAP reporting tools and data analytics.
- Yellowfin is a business intelligence platform, which is a single integrated solution designed for companies of various industries and sizes. This system is configured for enterprises in the field of accounting, advertising, agriculture.
- ClicData is a business intelligence (BI) solution designed primarily for use by small and medium-sized businesses. The tool allows end users to create reports and dashboards. Board was created to combine business intelligence, corporate performance management and is a fully functional system that serves mid-level and corporate companies.
- Domo is a cloud-based business management package that integrates with multiple data sources, including spreadsheets, databases, social networks, and any existing cloud or on-premises software solution.
- InetSoft Style Intelligence is a business intelligence software platform that allows users to create dashboards, visual OLAP analysis technology, and reports using the mashup mechanism.
- Birst from Infor Company is a networked solution for business analysts and analysis, which combines the ideas of various teams and helps to make informed decisions. The tool allows decentralized users to increase the model of corporate teams.
- Halo is a comprehensive supply chain management and business intelligence system that helps in business planning and inventory forecasting for supply chain management. The system uses data from all sources - large, small and intermediate.
- Chartio is a cloud-based business intelligence solution that provides founders, business groups, data analysts, and product groups with organizational tools for everyday work.
- Exago BI is a web-based solution designed for implementation in web applications. The implementation of Exago BI allows companies of all sizes to provide their customers with special, timely and interactive reporting.
Business Impact
The user will find OLAP in most business applications across industries.The analysis is used not only by business, but also by other interested parties.

Some of its most common applications include:
- Marketing OLAP data analysis.
- Financial statements that cover sales and expenses, budgeting and financial planning.
- Business process management.
- Sales analysis.
- Database Marketing.
Industries continue to grow, meaning users will soon see more OLAP applications. Multidimensional tailored processing provides more dynamic analysis. It is for this reason that these OLAP systems and technologies are used to evaluate what-if scenarios and alternative business scenarios.