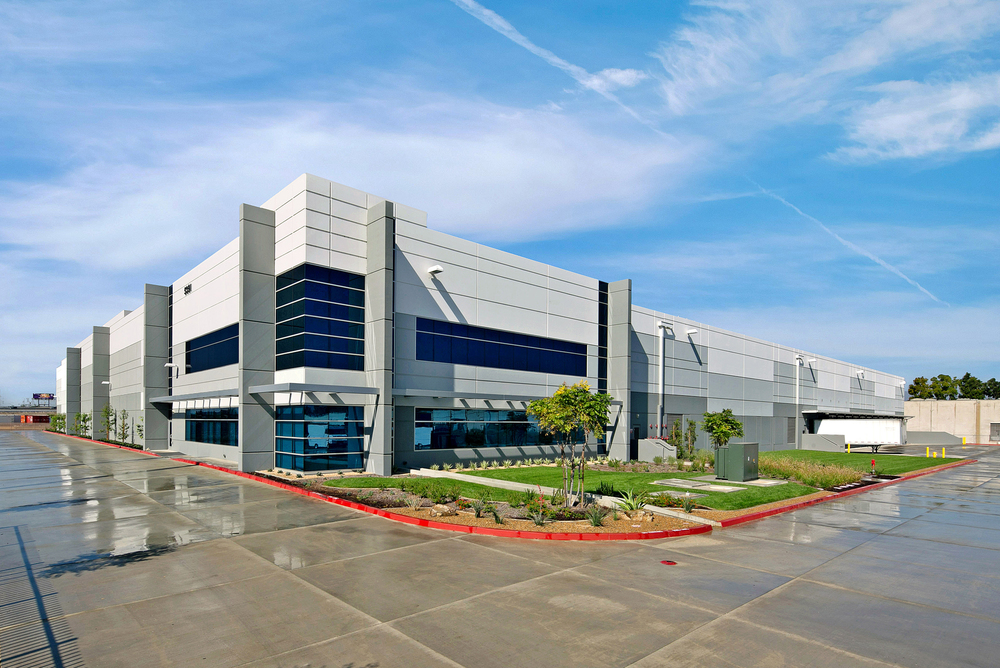
The project is the construction of an object (presumably a shopping and entertainment center). The facility is located in the city of Mytishchi, Moscow region, at the address: st. Letnaya, 26. The approximate date for commissioning the facility is 2019.
Object coverage areas
When developing the concept of building a business center, it is necessary to determine the boundaries of the service area surrounding the site.
Conventionally, the area around the object can be divided into three zones (depending on the proximity of location):
- 1st encirclement ring: limited by Yubileynaya, Mira streets, Yauza river.
- 2nd encirclement ring: covers most of the city, with the exception of remote areas - Stroitel, Chelyuskinskaya, Stroiplastmass, East Perlovka and Druzhba.
- 3rd ring of environment: covers the whole city of Mytishchi, including the areas of Stroitel, Chelyuskinskaya, Stroyplastmass, East Perlovka and Druzhba.
Internal and external factors of project success
External factors are beyond the control of the investor, but their influence on the subsequent development of the project is of fundamental importance in the implementation of the construction project of the business center.
A comparison of external and internal development factors is presented in the table below.
| External development factors | Internal factors of development |
|
|
Based on the analysis, we can conclude that, when deciding on the construction of a business center, several parameters must be taken into account:
- Prospects for the economic, social and demographic development of the region.
- The level of competition in the area of the facility.
- Socio-demographic characteristics of the population living in the area.
- Features of the object itself.
- Investment performance of the project.
It should be noted that the average cost of building business centers in St. Petersburg is 450 million rubles with an area of 40,000 square meters. m. However, this indicator differs slightly from the same in Moscow.
It should be noted that the cost of building business centers in Moscow is about 600 million rubles, with a quadrature of over 40,000 square meters. m
SWOT analysis of the object
Below is the final table of the SWOT analysis of the facility proposed for construction.
| S - Strengths | W - Weaknesses |
|
|
| O - Features | T - Threats |
|
|
After analyzing the strengths and weaknesses of the object, its development and threats, we can consider the possibility of implementing two different options for the use of space:
- Shopping center.
- Shopping and entertainment center.
Shopping center
In this case, you can focus on the shopping gallery. The large size of the shopping area will increase the variety of goods offered. Rental rates for retail premises are much higher than for entertainment areas. In this case, the coverage area of the shopping center will be only the first ring of the environment.
This business plan for the construction of a business center is the most optimal subject to the construction of a two-story facility.
Shopping and entertainment center
In the second case, you can focus on the entertainment component. The main advantage of this proposal is the fact that in the city market there is an acute shortage of places for leisure activities for children. The presence of an entertainment zone increases the time spent by customers on the property. In new shopping centers, the ratio of shopping and entertainment areas is 50% to 50%.
On the ground floor it is proposed to place a grocery supermarket.
If there are a large number of entertainment operators, the shopping and entertainment center will be able to attract visitors to the first and partially second rings of the city’s environment, as there are not enough entertainment venues in the city. It should be borne in mind that rental rates for this type of service are lower than for retail space, which will ultimately lead to an increase in the payback period of the project.
Foreign experience suggests that the most optimal implementation of the project will be the creation of a shopping and entertainment complex, as this option reduces commercial risks.
The planned business center belongs to class A. It is the highest among those that can be assigned. Class A assessment indicates the prestige of all the premises of the building, the availability of modern life support systems and the work of the center itself.
The cost of building a Class A business center using a specific example is presented below. We must not forget that the construction of a shopping center in another city may have completely different financial investments in volume.
Compilation of project cash flows
Presumably, the mall will have the following parameters when obtaining a building permit:
- The total area of the shopping center is 9672 square meters. m
- Including the 1st floor - 4847 sq. M. m
- Including the 2nd floor - 4825 square meters. m
- The occupancy rate in the 1st year is 70%.
- The occupancy rate in subsequent years is 95%.
- The risk of non-payments is 0%.
- Revenue growth per year - 5%.
Since the lease agreement sets the amount of the penalty for late payments of more than 30 days, the risks of non-payments during the construction of the business center are equal to zero. The annual increase in rental prices will be 5%.
This is illustrated more clearly by the table below.
Investments in the construction of the construction of a business center (RUB)
| Direction | Investments | 1 year | 2 year | TOTAL | For m2 |
| 1. Costs | Construction and installation work | 9 743 539 | 2 500 000 | 12 243 539 | 1 265,87 |
| 1.1. | other expenses | 192 500 | 0 | 192 500 | 19,9 |
| 1.2. | Partial result: | 9 936 039 | 2 500 000 | 12 436 039 | 1 285 |
| 2. Connections | Water supply | 147 482 | 0 | 147 482 | 15,25 |
| 2.1. | Sewerage | 118 942 | 0 | 118 942 | 12,3 |
| 2.2. | Heat supply | 184 843 | 0 | 184 843 | 19,11 |
| .2.3 | Power supply | 153 394 | 0 | 153 394 | 15,86 |
| 2.4. | For allocation of electricity limit | 398 942 | 0 | 398 942 | 41,25 |
| 2.5. | Partial result: | 1 003 603 | 0 | 1 003 603 | 104 |
| 2.6. | TOTAL | 10 939 642 | 2 500 000 | 13 439 642 | 1 390 |
The most important point is the study of capital investment financing issues. For this purpose, both own and borrowed funds of the company can be used. Below are the data on the financing of the construction project in more detail.
Project Financing:
- Total investments - 13439642 dollars.
- Including the 1st year - 10939642 dollars.
- Including the 2nd year - $ 2,500,000
- Total borrowed capital - $ 13,439,642, including 1st year: $ 10,939,642, 2nd year: $ 2,500,000
- Loan repayment term - 10 years.
- The interest rate on the loan is 18%.
In the process of studying the financial results of the project, an important point is the study of the amount and amount of the tax burden in the company according to the business plan.
The results of the planned tax deductions for the project are presented below.
Taxes paid during the operation of the project:
- For property - 2.2%.
- Profit - 20%.
- VAT - 18%.
To build the cash flow, we need to determine the approximate amount of revenue from renting out the premises, for which we need to carry out zoning of the shopping center area. Zoning elements are presented in the table below.
Zoning
| Profile | Total area, sq. m | Useful area, sq. m | Area, loss, sq. m |
| 1st floor | 4847 | 4078,5 | 768,5 |
| 2nd floor | 4825 | 3125,6 | 1699,4 |
| Total (absolute indicator) | 9672 | 7204,1 | 2467,9 |
| Total (relative indicator) | 100 % | 74,50 % | 25,50 % |
Calculation of income from the rental of premises for the planned business center is a central point, as it is associated with its effectiveness. There are various forecast options for obtaining such income: optimistic, average and pessimistic. The table below shows the characteristics of each option more clearly.
The first table presents the pessimistic forecast for the option of generating income.
Calculations of rental income. Rental Rates - Pessimistic Forecast
| Profile | Metric area m | % of the total area | Weighted average rental rate $ / sq. m / month | Weighted average rental rate $ / sq. m / year | Rent $ / year |
| 1st floor | 4078,5 | 56,61 | 53,9 | 646,8 | 2 637 974 |
| Small wing | 1202,6 | 16,69 | 29,5 | 354 | 425 720 |
| Big wing | 2875,9 | 39,92 | 69,9 | 838,8 | 2 412 305 |
| 2nd floor | 3125,6 | 43,39 | 33,9 | 406,8 | 1 271 494 |
| Total: | 7204,1 | 100,00 % | - | - | - |
| Weighted average rental rate | - | - | 43,2 | 518,4 | - |
| Rental income from the mall | - | - | - | - | 3 909 468 |
The data in the table allow us to conclude that as a result of the implementation of the project, the pessimistic size of the income from the rental of space in the mall will be $ 3909468.
The table below shows the data on the calculation of rental income from shopping center space with the averaged option.
Calculations of rental income. Rental Rates - Average
| Profile | Metric area m | % of the total area | Weighted average rental rate, $ / sq. m / month | Weighted average rental rate, $ / sq. m / year | Rent, $ / year |
| 1st floor | 4078,5 | 56,61 | 56,3 | 675,6 | 2 940 363 |
| Small wing | 1202,6 | 16,69 | 34,2 | 410,4 | 493 547 |
| Big wing | 2875,9 | 39,92 | 70,9 | 850,8 | 2 446 816 |
| 2nd floor | 3125,6 | 43,39 | 39,7 | 476,4 | 1 489 036 |
| Total: | 7204,1 | 100,00 % | - | - | - |
| Weighted average rental rate | - | - | 47,5 | 570 | - |
| Rental income from the mall | - | - | - | - | 4 429 399 |
The data in the table allow us to conclude that as a result of the implementation of the project, the average size of the received income from the rental of space in the mall will be $ 4,429,399.
It is also necessary to predict an optimistic forecast for the possible receipt of the object’s income from the lease of space, which is presented in the table below.
Calculations of rental income. Rental Rates - Optimistic Forecast
| Profile | Metric area m | % of the total area | Weighted average rental rate, $ / sq. m / month | Weighted average rental rate, $ / sq. m / year | Rent, $ / year |
| 1st floor | 4078,5 | 46,68 | 62,8 | 753,6 | 3 073 558 |
| Small wing | 1202,6 | 18,52 | 38,9 | 466,8 | 561 374 |
| Big wing | 2875,9 | 28,16 | 78,6 | 943,2 | 2 712 549 |
| 2nd floor | 3125,6 | 53,32 | 45,4 | 544,8 | 1 702 827 |
| Total: | 7204,1 | 100 | - | - | - |
| Weighted average rental rate | - | - | 53,5 | 642 | - |
| Rental income from the mall | - | - | - | - | 4 776 385 |
These tables allow us to conclude that as a result of the implementation of the project, the optimistic size of the income from the rental of space in the mall will be $ 4776385.
We calculate the cost of borrowed funds and the repayment schedule in the table below.
| Year | Balance to maturity | % of current payout | The main amount of current payments | Monthly payment |
| 1st | 13 439 642 | - | - | - |
| 2nd | 13 439 642 | - | - | - |
| 3rd | 13 439 642 | 2 359 379 | 1 187 184 | 8 690 008 |
| 4th | 12 252 458 | 2 205 442 | 1 009 137 | 3 214 579 |
| 5th | 11 243 321 | 2 023 798 | 1 190 782 | 3 214 579 |
| 6th | 10 052 540 | 1 809 457 | 1 405 122 | 3 214 579 |
| 7th | 8 647 417 | 1 556 535 | 1 658 044 | 3 214 579 |
| 8th | 6 989 373 | 1 258 087 | 1 956 492 | 3 214 579 |
| 9th | 5 032 881 | 905 919 | 2 308 661 | 3 214 579 |
| 10th | 2 724 220 | 490 360 | 2 724 220 | 3 214 579 |
Note: in the 3rd month, the monthly payment will include a two-year deferment of payment and capitalization of interest equal to $ 5143445.
The data in the table indicate that the monthly payment for the project will be 3214579 dollars per month.
other expenses
Consider and calculate all kinds of operating expenses during the construction of a business center:
- The first two years, the work of the guard will cover half of the constant volume.
- The calculation of cleaning services includes the cleaning of all areas and territories.
- The payment of wages in full is taken into account, taking into account all taxes and VAT.
- An annual salary increase of 5% per year.
- All operating expenses are transferred to tenants (except for the 1st year and half of the 2nd year expenses).
To compile the cash flow, we calculated the following data:
- Estimated average rental income for 10 years of project implementation, provided that in the first year, the leased area is 70%, and in the next 95%.
- Depreciation of property will be 3.33% per year.
Settlements in the framework of financial activities include excess interest according to tax laws, since the format before and after financing will not be drawn up.
Since the construction is accepted “according to the stages of work”, and the cash flow is formed starting from the first year, which starts from the moment the project generates the first ruble of income, the company loses the right to VAT refund in the first year upon completion of construction.
Since the project balance is a positive amount when the facility reaches 100% capacity, other and extraordinary expenses were not taken into account in the calculations.
Based on the available data, it seems possible to display the planned cash flows created by the project.
The table below shows the operational costs of the project.
Operating expenses
| Operating expenses | Year 1 | Year 2 | Year 3 | Year 4 | Year 5 | Year 6 | Year 7 | Year 8 | Year 9 | Year 10 |
| Administration | - | 53 515 | 102 311 | 105 649 | 110 590 | 115 777 | 121 225 | 126 944 | 132 949 | 139 255 |
| staff | - | 39 876 | 79 752 | 83 740 | 87 927 | 92 323 | 96 940 | 101 787 | 106 876 | 112 220 |
| Consumables | - | 3 476 | 6 952 | 5 793 | 5 793 | 5 793 | 5 793 | 5 793 | 5 793 | 5 793 |
| equipment | - | 2 000 | - | - | - | - | - | - | - | - |
| VAT | - | 8 163 | 15 607 | 16 116 | 16 870 | 17 661 | 18 492 | 19 364 | 20 280 | 21 242 |
| Cleaning | - | 46 582 | 99 715 | 97 191 | 101 419 | 105 859 | 117 072 | 115 417 | 120 557 | 125 953 |
| staff | - | 34 130 | 68 260 | 71 673 | 75 256 | 79 019 | 82 970 | 87 119 | 91 475 | 96 048 |
| Consumables | - | 5 346 | 10 692 | 10 692 | 10 692 | 10 692 | 10 692 | 10 692 | 10 692 | 10 692 |
| equipment | - | - | 5 552 | - | - | - | - | - | - | - |
| VAT | - | 7 106 | 15 211 | 14 826 | 15 471 | 16 148 | 17 858 | 17 606 | 18 390 | 19 213 |
| Those. service | - | 44 149 | 81 418 | 85 335 | 89 450 | 93 770 | 98 305 | 103 067 | 108 068 | 113 319 |
| staff | - | 33 204 | 66 408 | 69 728 | 73 215 | 76 876 | 80 719 | 84 755 | 88 993 | 93 443 |
| consumables, including workwear | - | 2 210 | 2 590 | 2 590 | 2 590 | 2 590 | 2 590 | 2 590 | 2 590 | 2 590 |
| licenses | - | 2 000 | - | - | - | - | - | - | - | - |
| VAT | - | 6 735 | 12 420 | 13 017 | 13 645 | 14 304 | 14 996 | 15 722 | 16 485 | 17 286 |
| Security | 104 379 | 96 104 | 195 137 | 206 919 | 214 838 | 227 604 | 236 558 | 245 310 | 262 676 | 273 385 |
| staff | 81 444 | 81 444 | 162 887 | 171 032 | 179 583 | 188 562 | 197 990 | 207 890 | 218 284 | 229 199 |
| consumables, including workwear and equipment | 7 013 | - | 2 483 | 4 323 | 2 483 | 4 323 | 2 483 | - | 4 323 | 2 483 |
| VAT | 15 922 | 14 660 | 29 767 | 31 564 | 32 772 | 34 719 | 36 085 | 37 420 | 40 069 | 41 703 |
| Insurance | 0 | 0 | 0 | 0 | 0 | 0 | 0 | 0 | 0 | 0 |
| building | - | - | - | - | - | - | - | - | - | - |
| responsibility | - | - | - | - | - | - | - | - | - | - |
| Communal payments | 31 357 | 31 357 | 62 715 | 65 850 | 69 142 | 72 600 | 76 229 | 80 041 | 84 043 | 88 245 |
| Weighted average consumption per sq. m / year | 15,1 | 30,3 | 60,4 | 62,6 | 65,3 | 68,7 | 72,5 | 74,8 | 79 | 82,6 |
| Total per year | 135 736 | 271 707 | 541 296 | 560 944 | 585 439 | 615 610 | 649 389 | 670 779 | 708 293 | 740 157 |
| Owner operating expenses | 135 736 | 135 854 | 0 | 0 | 0 | 0 | 0 | 0 | 0 | 0 |
The table below shows that the amount of operating expenses in the first year will be $ 271,707, then it will increase by year and will reach $ 740157 in the 10th year.
In a subsequent analysis of project effectiveness, the dynamics of project income over the first 10 years will be considered in the table below.
Project Revenues
| Income | Year 1 | Year 2 | Year 3 | Year 4 | Year 5 | Year 6 | Year 7 | Year 8 | Year 9 | Year 10 | TOTAL |
| Occupancy rate (%) | 0% | 70% | 95% | 95% | 95% | 95% | 95% | 95% | 95% | 95% | - |
| Rental income (average) | 0 | 2 717 987 | 3 873 132 | 4 066 789 | 4 270 128 | 4 483 635 | 4 707 816 | 4 943 207 | 5 190 367 | 5 449 886 | 39 702 947 |
The data in the table allows us to conclude that the amount of project income in the first year will amount to $ 2,717,987, then revenues will increase, by the 10th year they will amount to $ 3,970,2947.
When researching a project, the calculation of depreciation deductions, which is presented in the table below, is important.
Project depreciation
| Depreciation 3.33% per year | Year 1 | Year 2 | Year 3 | Year 4 | Year 5 | Year 6 | Year 7 | Year 8 | Year 9 | Year 10 | TOTAL |
| Property value | 10 107 658 | 13 107 659 | 12 845 506 | 12 588 596 | 12 336 824 | 12 090 087 | 11 848 286 | 11 611 320 | 11 379 093 | 11 151 512 | - |
| Amortization Amount | 0 | 0 | 262 153 | 256 910 | 251 772 | 246 736 | 241 802 | 236 966 | 232 226 | 227 582 | 1 956 147 |
As can be seen from the table, the amount of depreciation in the third year will be $ 262,153, and in the last, 10th year - $ 227,582. The total amount of depreciation for all years of the project will be $ 1,956,147.
The table below shows the cash flow for the project.
Cash flow
| CASH FLOW | Year 1 | Year 2 | Year 3 | Year 4 | Year 5 | Year 6 | Year 7 | Year 8 | Year 9 | Year 10 | TOTAL |
| Primary activity | - | - | - | - | - | - | - | - | - | - | - |
| Gross income | -10 107 658 | -282 013 | 3 873 132 | 4 066 789 | 4 270 128 | 4 483 635 | 4 707 816 | 4 943 207 | 5 190 367 | 5 449 886 | 26 595 289 |
| Operating costs | -135 736 | -135 854 | 0 | 0 | 0 | 0 | 0 | 0 | 0 | 0 | -271 590 |
| VAT payable | 0 | 0 | -590 817 | -620 358 | -651 375 | -683 944 | -718 141 | -754 049 | -791 751 | -831 339 | -5 641 774 |
| Operating activities | -10 243 394 | -417 866 | 3 282 315 | 3 446 431 | 3 618 753 | 3 799 690 | 3 989 675 | 4 189 159 | 4 398 616 | 4 618 547 | 20 681 926 |
| 11% CT - NB reduction | 0 | 0 | 4 585 059 | 1 347 770 | 1 236 765 | 1 105 779 | 951 216 | 768 831 | 553 617 | 299 664 | 10 848 702 |
| Property tax | 0 | -262 153 | -256 910 | -251 772 | -246 736 | -241 802 | -236 966 | -232 226 | -227 582 | -223 030 | -2 179 178 |
| Income tax | 0 | 0 | -1 826 511 | -1 090 183 | -1 106 108 | -1 119 280 | -1 128 942 | -1 134 183 | -1 133 916 | -1 126 843 | -9 665 967 |
| TOTAL RESULTS | -10 243 394 | -680 019 | 5 783 953 | 3 452 246 | 3 502 674 | 3 544 388 | 3 574 983 | 3 591 580 | 3 590 735 | 3 568 338 | 19 685 484 |
| Financial activities | - | - | - | - | - | - | - | - | - | - | - |
| 7% over the norm | 0 | 0 | -2 917 758 | -857 670 | -787 031 | -703 676 | -605 318 | -489 255 | -352 301 | -190 695 | -6 903 704 |
| Loan body | 0 | 0 | -855 201 | -1 009 137 | -1 190 782 | -1 405 122 | -1 658 044 | -1 956 492 | -2 308 661 | -2 724 220 | -13 107 659 |
| Payment to founders | 0 | 0 | 0 | 0 | 0 | 0 | 0 | 0 | 0 | 0 | 0 |
| FINANCIAL RESULTS | 0 | 0 | -3 772 959 | -1 866 807 | -1 977 812 | -2 108 798 | -2 263 362 | -2 445 747 | -2 660 962 | -2 914 915 | -20 011 363 |
| Investment activities | - | - | - | - | - | - | - | - | - | - | - |
| VAT refund | 1 562 552 | 63 742 | - | - | - | - | - | - | - | - | 1 626 294 |
| TOTAL on investment activities | 1 562 552 | 63 742 | 0 | 0 | 0 | 0 | 0 | 0 | 0 | 0 | 1 626 294 |
| TOTAL overall | -8 680 842 | -616 277 | 2 010 994 | 1 585 439 | 1 524 862 | 1 435 589 | 1 311 621 | 1 145 833 | 929 773 | 653 423 | 1 300 415 |
The table shows that the total cash flow for the project will be $ 1,300,415.

Discount Rate Estimation
It is used to recalculate future income streams into a single value at the moment. The discount rate (r) will be calculated cumulatively by the formula:
r = α + MRR * RI,
Where
α is the average inflation rate over the period.
MRR (Minimum Risk of Return) - the minimum real rate of risk associated with the functioning of the project.
RI (Investment Risk) - the level of average required profitability (risk) by project participants.
The minimum real MRR risk rate for this case will be equal to the cost of borrowed funds, namely 18%, that is, the rate on a bank loan.
In accordance with the investment agreement, the average required RI yield by the project participants is set at 2%.
Thus, the discount rate will be equal to:
r = (0.13 + 0.18 * 1.02) * 100% = 30%
findings
When drawing up a business plan for the construction of a business center, the project was considered, optimistic conclusions were drawn.
Over the next three years, a moderate economic growth will be observed in Mytishchi district, however, the lag of the average indicators for the district from the average indicators for the Moscow region is expressed. The leading industries will remain engineering, instrument making, and construction industry.
By the end of 2018, it is planned to increase the growth rate of retail trade by 40% and increase the annual volume of household services by 35%. The growth of trade will be ensured by the growth of the middle class and its income.
Areas that meet international standards are in acute shortage, the demand for quality retail space exceeds supply. This will lead to an increase in the quality of the creation and management of the mall.
The main sources of demand today are clothing stores. They account for about 50% of the area in shopping centers. The level of free space in 2018 will be 10-15%. The expected increase in retail real estate will be about 75,000 sq. M. m. Currently, the average rental rate for commercial premises in the city is about $ 405 / sq. m. per year (including VAT and operating expenses).
In the zone of the first ring of the environment there are a large number of objects that compete both in the food sector and in the industrial goods sector.
When calculating cash flows, the average rental rate, the availability of premises at the level of 5%, as well as all operating costs and loan payments were taken into account. The cash flow for the project turned out to be positive, but still not large enough.
The discount rate, which includes the average inflation rate, the risk generated by the project, and the average required return, was 30%.
Thus, the submitted project can be accepted for consideration, since the calculations show its profitability and effectiveness.