The theory of economics studies human activity, which is associated with the achievement of the efficient use of resources to better meet the necessities of life. The formation of basic goods is realized at enterprises by the organization of production. This determines the production capability curve.
Production definition
Production is a rational human activity aimed at satisfying basic needs. This is a public process, because people are engaged in joint economic activities. The process includes the interaction of the main factors of production - labor, capital, land, entrepreneurship. The result of production is the creation of tangible and intangible goods that satisfy the needs of people.
Types of human needs
Human needs can be classified as a state of discontent or needs that a person seeks to abandon. Needs change, evolving along with human civilization. Classification of needs very diverse. Needs that must be met can be divided into final (consumption objects) and intermediate (production assets).
Final needs are the needs of man as a biosocial being. They are also called personal needs. As a result of meeting these needs, a person is restored. These are commodities: food, clothing, residence, etc. By consuming them, a person takes these benefits out of the economy.
Intermediate needs are directly related to the person. These are the needs of farm buildings. Meeting these needs serves to create new benefits. Such needs are considered productive, and their satisfying benefits are considered productive means. In the process of using these benefits, they do not disappear, but are reformed and serve to satisfy other needs. Basically, the benefits that are needed to meet human needs do not exist in finished form. They are created, produced using resources that people possess.
Opportunities for social production
Opportunities for the production of society - this is the most likely volume of the production of goods with the efficient use of existing resources. Production efficiency is the ratio of the result obtained to the costs and resources.
The costs of some goods, expressed in others, which had to be sacrificed, are called opportunity costs. Possible production of consumer products shows a curve of production opportunities.
You must choose when the conditions of relative scarcity of resources apply. The choice is made between the options for the optimal use of resources. The best option will be that will provide the best result at low cost.
Alternative use of resources
Social needs are increasing and are oriented towards increasing the result. But the resources are not infinite, and the possibilities of production are limited. The growth of production volumes of one product can occur only when the refusal to manufacture another. Because of resources are limited they are alternatively used. Because resources are rare, a full economy of production will not provide an immense output of services and goods. Moreover, it is necessary to decide which services and goods need to be produced and which not.
Limited resources limit the output of services and goods.Since the resources are not unlimited and are used in full, the growth of production in one area, for example, in the production of automobiles, needs to switch part of the resources from the production of another area, for example, oil production. And vice versa - if you produce more oil, then you need to reduce car production. With the full use of resources, society cannot set two completely different goals. This refers to the opportunity cost; the price of production of a service or product, which is measured in terms of the missed production potential of other types of services, or goods that require the very same expenditure of resources. The price of changing one good for another.
Society is obliged to choose whether to produce oil or cars, or guns and oil in some proportions. In this case, the problem of rational farming appears. This problem will always stand.
Graphic image of oil and car production
For a deep understanding of the content of production opportunities, you can use the previous example and give it a graphic picture, laying out horizontally oil production, and vertically - automobile production. As a result, we have a production curve. This is a union of points, coordinates. The production capability curve characterizes different combinations of the largest sizes of production of two services and goods that can be formed under conditions of full employment in an economy with stable reserves and constant technology.
Production Capability Curve: Graph
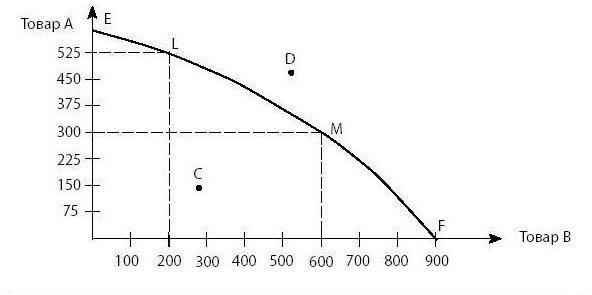
The ordinate axis shows the probable production values of goods A with a small resource volume, the abscissa axis shows the probable volumes of production of goods B from the same amount of resources. If you connect the maximum points, you get a curve of production capabilities. All points on the PV curve represent a certain large manufacturing size of two products.
It sets the boundaries for better production of goods A and B at the same time, while using minimal resources. The production capability curve provides that the choice of the most suitable option is limited by their number, which, in turn, is represented by a collection of curve points. With an increase in production A, we lose the number of goods B, and vice versa. The production capability curve reflects a negative subordination between the paired sizes of the largest production indicators. The amount of loss of one product at the maximum production of another is called the alternative price.
Car and oil production curve
This curve shows some boundary. In order to carry out various production combinations of automobiles or oils, society is obliged to carry out the largest employment of resources and a large size of production.
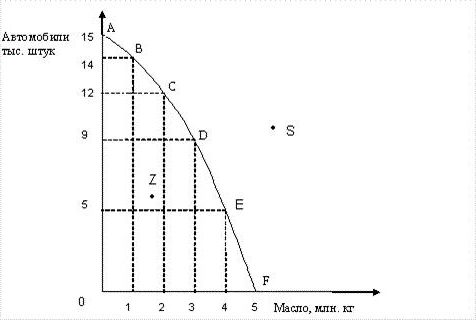
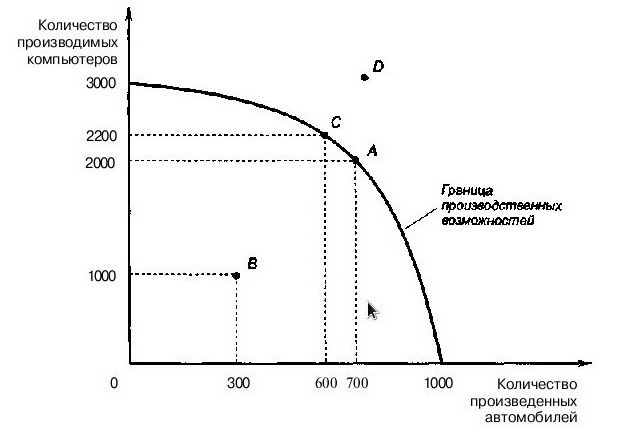
All points of the combination of oil and cars on the curve show the largest quantities that can be obtained as a result of the most efficient use of all available resources. A point on the curve of production capabilities A (Fig. 1) shows that the entire amount of resources is directed to automobile production, goods of industrial significance. Point F indicates that all resources are directed to oil production.
The production capability curve reflects that these two points are extremes. Different kinds of economies balance in the distribution of co-production between intermediate goods and consumer goods.
Moving from point A to point F, we are expanding the production process of consumer goods (oil), switching resources allocated for the manufacture of means of production. In this case, the production capability curve characterizes automobiles as an alternative oil price.
Reallocation of resources
Consumer goods directly satisfy our needs.Going to point F, society is enhancing the satisfaction of its needs. But such a redistribution of resources over time will cause damage to society itself, since the stock of its implements of production will cease to grow and decrease, which will reduce the potential for subsequent production. And vice versa, moving in the opposite direction, society abstains from current consumption. This makes available the resources that are used to increase the production of means of production, then oil is the alternative price of cars. By increasing the supply of capital, society can create a large volume of production, designed for a large amount of consumption in the future, which uses production. The production curve does not include all points.
Points beyond the transformation curve
Points beyond the transformation curve (point S) (Fig. 1) are preferable to other points on the curve. But these points cannot be achieved with so many resources and production technology. A small amount of resources rejects any combination of production of production assets and commodities at the point that exists near the curve of production capabilities.
All points in the middle of the production opportunity curve reflect incomplete economic resources. The production capability curve implies that if we move towards absolute resource utilization and full production volume, society can increase the quantity of either one or two products. This point indicates that additional resources can increase the production of both cars and oils.
Law of additional costs
Based on all this, it can be determined that a large amount of oil is produced only when automobile production is reduced. Refuse cars to get a certain amount of another product, which is called the imputed production costs of the product. In this example, the number of cars that will need to be abandoned in order to get another unit of oil is the imputed or alternative costs.
The law of increasing imputed costs (additional costs) applies here, it reflects the property of the market economy, which states that in order to get each unit of addition of a product, you have to pay by losing the amount of other goods, goods. Due to the fact that production capabilities and resources are limited, the benefits are also not unlimited.
AT economy concept transformation is the alternative to a full-time economy. So, she must choose between the production of production assets and consumer products through the redistribution of resources, this is the problem of choice. The production capability curve describes resource constraints.
The main idea is this: at any time, the economy of absolute employment and output must sacrifice part of product X to get a larger amount of product Y. The rarity of the resources of the economy does not allow it to equally increase X and Y.
The difference in the scope of production opportunities in different countries
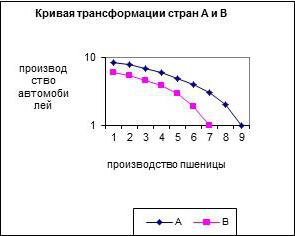
The production capability transformation curve also illustrates the differences that exist in the area of production capabilities in different countries. The transformation curves of country A and country B. The potential of country A is higher than B. Even if country B were completely engaged only in the production of cars, its potential would reach point Z1.
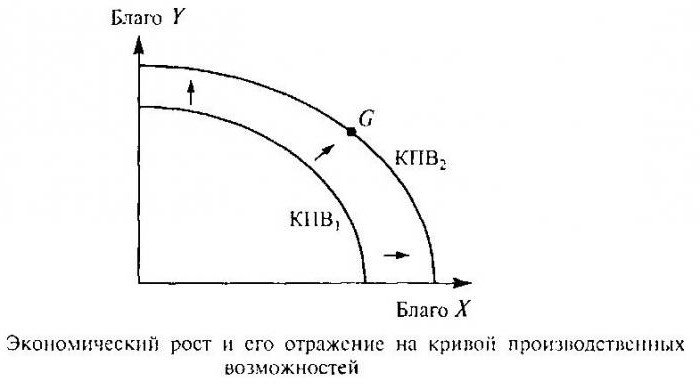
Country A, with a similar task, will achieve maximum car production at point Z2, this is due to the fact that the automotive industry is better developed in country A. A transition from a low to a level above the PV curve can only be made if the economy grows, technical discoveries and development of new mineral deposits, scientific discoveries in various fields of human activity.
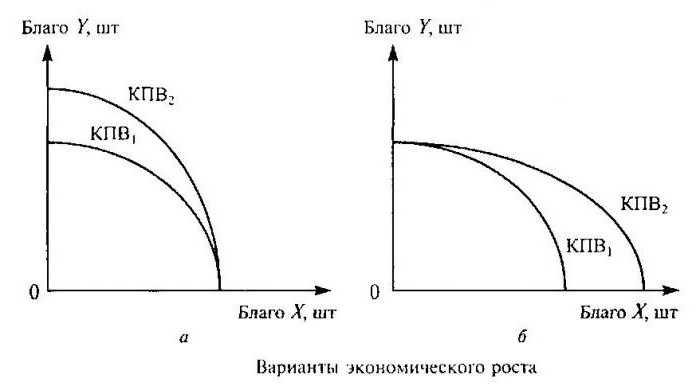
The shift of the curve of production opportunities with the expansion of one type of production is asymmetric. This fact can be used to characterize structural shifts between private and public goods, between agriculture and industry.
Curve of production transformation opportunities in countries A and B
Society needs to choose from accumulation (investment) and consumption. If for a while we deviate from increasing a certain level of consumption of various services and goods (personal, non-production) and expanding our accumulative sizes (building new factories, factories), we can come to a higher transformation curve after a certain number of years.
Increasing production capabilities by expanding the number of resources is an extensive path. And an increase due to factors that allow us to increase the effectiveness of using fixed resources in quantity is an enhanced way to increase production capabilities.
The physical basis of the enhanced path of increasing opportunities is determined by scientific and technological progress. But even the highest speed of building up production capacities in society cannot fully solve the problem of resource limitations. Therefore, the public is always obligated to make decisions about what to produce and what needs to refuse.
