The Laffer curve is a theoretical concept showing the relationship between the rate of tax revenues and the state budget revenue through part of the taxes. The system was developed in 1974 by US economist Arthur Laffer. Sometimes curve indicators are used as an argument for tax cuts.
Concept
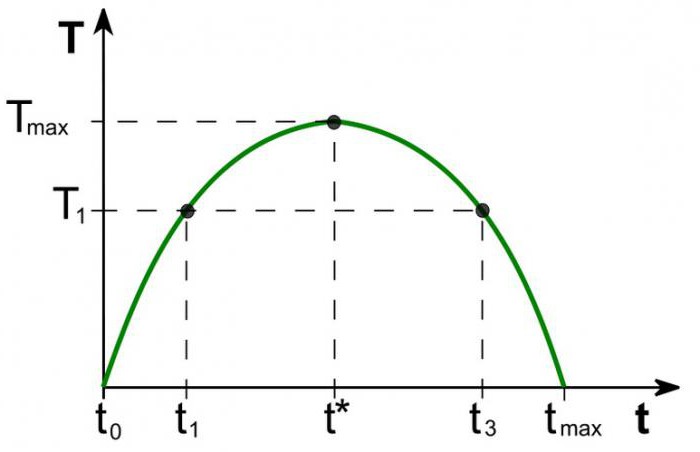
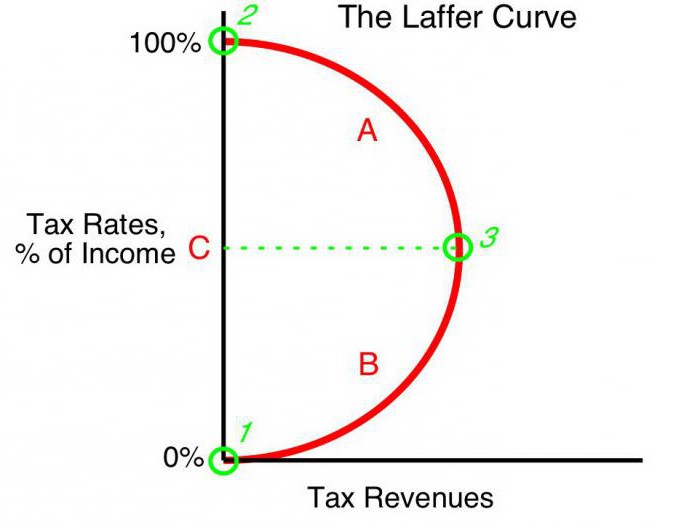
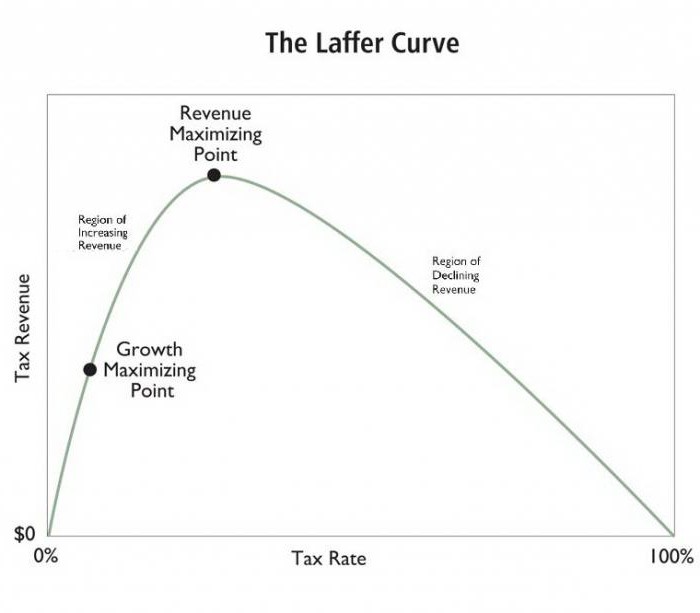
The value of budget revenues at a rate equal to income tax tends to zero (t0 = 0%). According to Laffer’s theory, a gradual increase in tax rates will result in a smaller increase in tax revenue at a point where a further increase in tax rates reduces overall tax revenue. At indicators when the income tax rate is 100% (tmax = 100%), revenues drop to zero.
The point on the Laffer curve corresponding to the maximum tax revenue rate is called the saturation point (Tmax) In form, the Laffer curve shows that the government can achieve an equal level of tax revenue for two different tax rates (T1) - in the first quarter (t1) and the third quarter of the curve (t3).

Theory
The Laffer curve is based on the following assumptions:
- At tax rate t0= 0% taxpayers do not pay any taxes, respectively, the state budget does not record taxes.
- An increase in the tax rate causes two opposite effects: an increase in the share of state revenue of the budget of traders and a decrease in the declared taxable income of business entities.
The second effect of increasing the Laffer tax rate is explained by:
- Reduced incentives to work and economic activity. That is, the limitation of the benefits that operators had in a certain area encourages them to reduce economic activity and limit their activities in this area.
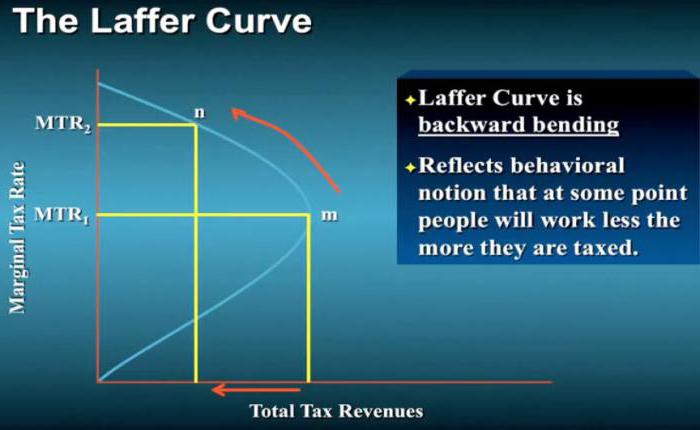
- An increase in hidden income due to the departure of traders in the shadows. At a higher tax rate, it is beneficial for business entities (despite the risks) not to pay taxes completely. The Laffer curve clearly shows this.
- The growing trends in the movement of economic activity, especially large enterprises, abroad.
With a certain maximum level of taxation tmax = 100% all incentives to work disappear and the point is to conduct a taxable business. Having no motivation to work, organizations cease operations. Thus, they cease to exist as objects of taxation, respectively, income is zero.
Practice
The Laffer curve describes the relationship between government taxes and treasury income, allowing us to find a saturation point mutually beneficial for the government and business executives (Tmax) Laffer’s concept is the most famous model of the economy, the authors of which called for lowering tax rates in order to stimulate investment and reduce the role of the state in the economy for the sake of competitiveness.
Basic premise for state fiscal policy formulated on the basis of the Laffer curve, there is the opportunity (under certain conditions) to increase the population of the budget while lowering rates.
US theory
The truly impressive effect of applying the lessons of the American economist in business practice has been achieved in some countries. Interestingly, in addition to increasing budget revenues and increasing the pace of the economy, there was a significant redistribution of income within society.
In 1925, the United States lowered the high level of personal income tax from 73% to 25%. The budget for income from this tax increased from $ 719 million (1921) to $ 1 billion (1929).Moreover, income from the rich (annual earnings over $ 100,000) in the total tax volume from 28% (1921) increased to 51% (1926). On the contrary, taxpayers with the lowest incomes (below 10,000) paid 23% in 1921, and in 1926 only 5% of the amount of all tax revenues.
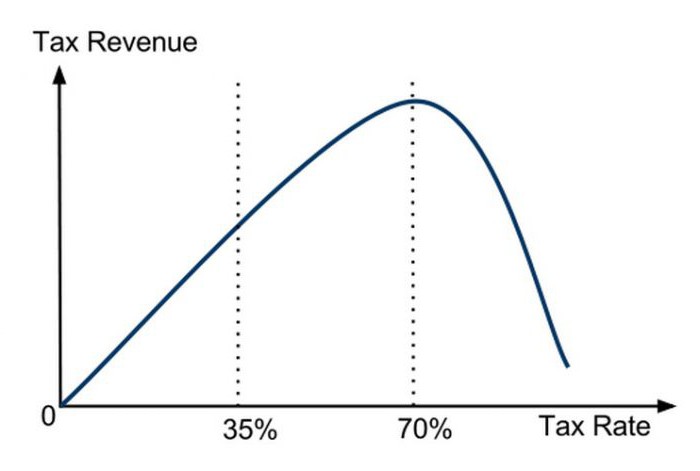
The first direct application of Laffer's concept in economic policy is associated with a significant reduction in the rate of profit in the USA in 1981. The administration of President R. Reagan reduced the maximum tax rate first from 70% to 50%, and then, in 1986, to 28%, and achieved a positive effect. Then it was practically confirmed that the tax rate and the Laffer curve are interconnected, that the bare theory works.
Application in Poland
In Poland, the experience with the Laffer curve is related to excise taxes on alcohol. The increase in excise taxes on alcohol in 1999-2001 contributed to a decrease in revenues (contrary to expectations) of the state budget. The decrease in excise taxes in 2002, on the contrary, increased revenues. That is, the Laffer curve reflects the relationship with the profitability of any types of taxes, and not any specific ones.
Another Polish example: an increase in excise tax rates on tobacco products provoked a decrease in income, which was due to a simultaneous increase in the use of smuggled cigarettes. The increase in excise taxes in Poland was accompanied by both a decrease in domestic production and a decrease in legal sales of tobacco products, while the number of smokers did not change. At the same time, statistics showed a parallel increase in the shadow economy and smuggling excisable goods. The subsequent decrease in excise taxes from 27% to 19% caused a significant increase in budget revenues from this tax.

Arguments and Counterarguments
Although the Laffer curve shows a positive relationship between profitability and lower taxes, the concept has opponents. They note that tax cuts in the 80s in the United States were accompanied by increases budget deficit. This is a strong argument in the hands of critics, but supporters retort that an increase in revenue did occur, and a deepening budget deficit led to an increase in budget spending.
Nevertheless, regardless of the impact of significant tax cuts on the level and structure of tax revenues, the Laffer curve had a definite positive effect on US economic growth in the 1980s.
Curve shapes
According to progressive economists, the Laffer curve describes the possibility of lowering the tax rate to fill the budget. Often the concept is used by proponents of economic liberalism to justify tax cuts. It should be emphasized that, although the concept of the Laffer curve in some economic conditions justifies tax cuts in order to increase budget revenues, there is no clear evidence of this connection.
The only true method of statistical analysis is an empirical study of the reaction of the amount of tax revenue to changes in the tax rate. Some studies show that the actual Laffer curve is significantly different from the “canonical” one and has an asymmetric shape. Setting the rate of maximizing state tax revenues is an extremely complex process and involves numerous difficulties.
Volatility
It is noted that the Laffer curve describes the relationship of the "ideal relationship" of taxes and income, not taking into account the trends of the time. For example, in conditions of a military threat, citizens are ready to bear a heavy burden for the sake of the state. An additional increase in taxes for military purposes leads to an increase in revenue from this source. Thus, the saturation point on the Laffer curve will be significantly shifted to the right. After the war, countries usually lower tax rates.Its reduction can again increase budget revenues, as a result, the tax rate (although in wartime it is often set below the saturation level) will be higher than with the post-war saturation rate. With the cessation of threats, the shape of the curve also changes; the rate of saturation decreases significantly.
Location Impact
The Laffer curve also describes the relationship between the region and tax revenue, that is, the shape of the curve depends on the location. Non-tax conditions for doing business in different places of one country may vary. For example, in border regions it is easier to replace domestic alcohol taxed by high excise taxes with cheap imports. Consumers will be tempted to buy less excisable products, and acquire smuggled goods. The tax base will decrease accordingly. The saturation point on the graph will be significantly shifted to the left compared to the central regions, where the delivery of clandestine products is complicated and less cost-effective for smugglers.
Short term
One of the problems that the conductors of the state’s economic policy are faced with is the restriction on the use of the Laffer system, which is associated with the difference in the curve performance in the short and long term. In the short-term, operators cannot quickly respond to changes in the tax rate, even if it is rapidly moving towards maximum taxation.
Theoretically, it can be argued that in the ultra-short period at the maximum rate tmax = 100%, budget profitability will not fall (contrary to theory) to zero. This is due to the delayed reaction of traders to force majeure. Operators will gradually reduce economic activity in the hope of the prudence of the government, or by inertia of production. This means that until the complete cessation of economic activity for some time they will pay taxes in the amount of 100% of income. In addition, some (perhaps most) organizations will go into the shadow business, “diligently” paying 100% of the rate from official income in order to maintain the appearance of legitimate activity.
Long-term perspective
When the government develops a long-term tax perspective, the Laffer curve works more accurately, allowing more efficient business planning for all economic entities. However, optimization of the tax rate based on the Laffer curve is not easy for the authorities and requires a political decision. The short electoral cycle in developed countries often forces governments to work in the short term, seriously limiting the applicability of Laffer's ideas in business practice.