It is known that output means investing in its production and sale. Each entrepreneur, intending to create a blessing, pursues a goal - this is making profit from the sale of goods / services. The break-even chart helps to see in value and physical terms the revenue and the volume of production at which profit is zero, but all costs are already covered. Accordingly, stepping over breakeven point each subsequent unit of good sold begins to make a profit for the enterprise.
Chart Data
In order to draw up sequential actions and get an answer to the question: “How to build a break-even chart?”, An understanding of all the components necessary to create a functional dependence is required.
All costs of the company for the sale of products are gross costs. The division of costs into fixed and variable allows you to plan profit and is the basis for determining the critical volume.

Rental of premises, insurance premiums, depreciation of equipment, remuneration, management - these are components of fixed costs. They are united by one condition: all of these costs are paid regardless of the volume of production.
The purchase of raw materials, transportation costs, remuneration of production personnel are elements of variable costs, the amount of which is determined by the volume of goods produced.
Revenue is also the source of information for finding a breakeven point and is expressed as the product of sales by price.
Analytical method
There are several ways to determine the critical volume. By the analytical method, that is, through the formula, a breakeven point can also be found. A schedule is not required in this case.
Profit = Revenue - (Fixed costs + Variable expenses * Volume)
Break-even determination is performed provided that the profit is zero. Revenue is a product of sales and price. It turns out a new expression:
0 = Volume * Price - (Fixed costs + Variables * Volume),
After elementary mathematical procedures, the resulting formula is:
Volume = Fixed costs / (Price - Variable costs).
After substituting the initial data in the resulting expression, the volume is determined, which covers all the costs of the realized good. You can go from the opposite, setting the profit is not zero, but the target, that is, the one that the entrepreneur plans to get, and find the volume of production.
Graphical method
To predict the main indicators of the enterprise, given the constant conditions in the market, such an economic instrument as the break-even schedule is capable. The main steps:
- The dependence of sales volumes on revenue and costs is built, where the X-axis reflects data on volume in physical terms, and on Y - revenue, costs in monetary terms.
- A straight line parallel to the X axis and corresponding to fixed costs is built in the resulting system.
- Coordinates corresponding to variable costs are postponed. The straight line rises up and starts from zero.
- Direct gross cost is plotted on a graph. It is parallel to the variables and takes its origin along the ordinate axis from the point from which the construction of fixed costs began.
- Construction in the system (X, Y) of a straight line characterizing the revenue of the analyzed period. Revenues are calculated provided that the price of the products does not change during this period and output is uniform.
The intersection of direct revenues and gross expenditures projected onto the X axis is the desired value - the breakeven point. An example chart will be considered below.
Example: how to build a break-even chart?
An example of constructing a functional dependence of sales volumes on revenue and costs will be made using the Excel program.
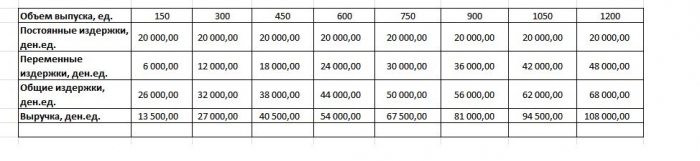
The first thing to do is to consolidate the data on revenue, costs and sales volumes into a single table.
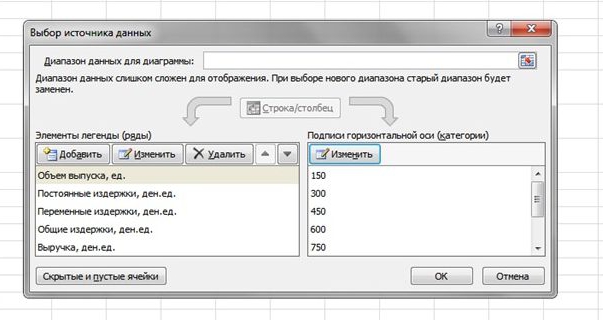
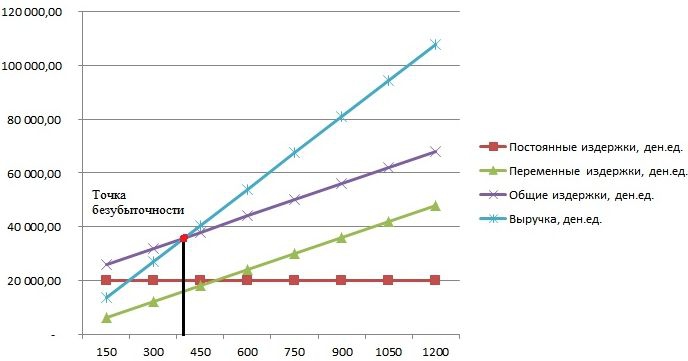
Next, you need to call the function "Chart with markers" through the toolbar using the "Insert" tab. A blank window will appear, right-clicking on a data range that includes cells of the entire table. The signature of the X axis is changed through the selection of data related to output. Then, in the left column of the "Select Data Source" window, you can delete the output volume, since it coincides with the X axis. An example is shown in the figure.
If you project the intersection point of direct revenues and gross costs on the abscissa axis, then a volume of about 400 units is clearly defined, which characterizes the breakeven of the enterprise. That is, having sold over 400 units of products, the company begins to work in plus, receiving revenue.
Formula Example
The initial data of the task are taken from the table in Excel. It is known that production is cyclical and amounts to 150 units. The issue corresponds to: fixed costs - 20,000 den.ed; variable costs - 6,000 den. units; revenue - 13 500 den. units It is necessary to calculate the breakeven.
- Determination of variable costs for the production of one unit: 6000/150 = 40 den. units
- The price of one realized good: 13,500 / 150 = 90 den. units
- In physical terms, the critical volume: 20,000 / (90 - 40) = 400 units.
- In value terms, or revenue in this volume: 400 * 90 = 36,000 den. units
The breakeven schedule and the formula led to a unified solution to the problem - determining the minimum volume of production that covers the cost of production. Answer: 400 units must be issued in order to cover all costs, while the revenue will be 36,000.00 den. units
Constraints and conditions of construction
The simplicity of estimating the level of sales at which the costs of selling products are reimbursed is achieved through a number of assumptions made for the availability of the model. It is believed that the production and market conditions are ideal (and this is far from reality). The following conditions are accepted:
- Linear relationship between output and cost.
- All produced volume is equal to the realized. There are no stocks of finished products.
- Product prices are unchanged, as are variable costs.
- Lack of capital costs associated with the acquisition of equipment and the start of production.
- A specific time period is adopted during which the amount of fixed costs does not change.
Due to the above conditions, the breakeven point, an example of the finding of which was considered, is considered a theoretical value in the projection of the classical model. In practice, calculations in multinomenclature production are much more complicated.
Model flaws
- The volume of sales is equal to the volume of production and both quantities vary linearly. Not taken into account: customer behavior, new competitors, seasonality of release, that is, all conditions affecting demand. New technologies, equipment, innovations and more are also not taken into account when calculating output volumes.
- Break-even position is applicable for markets with steady demand and low level of competition with competitors.
- Inflation, which may affect the cost of raw materials, rents, is not taken into account when setting one price of products for the period of break-even analysis.
- The model is inappropriate for use by small enterprises for which the sale of products is unstable.
The practical use of the breakeven point
After the specialists of the enterprise, economists and analysts, carried out the calculations and built a break-even schedule, external and internal users draw information to make a decision on the further development of the company and investing.

The main goals of using the model:
- Calculation of product prices.
- Determining the volume of output, ensuring the profitability of the enterprise.
- Determining the level of solvency and financial reliability. The further the output is further from the breakeven point, the higher the financial strength margin.
- Investors and creditors - assessment of the development effectiveness and solvency of the company.