Inequality in the distribution of income lies in the very essence of a market economy. Even in a perfectly just society, it will exist, since we are all distinguished by natural abilities. Inequality in income distribution is usually illustrated by the situation when a small part of the population has a significant share of national wealth, and vice versa. For its measurement, in particular, the Lorentz curve is used.

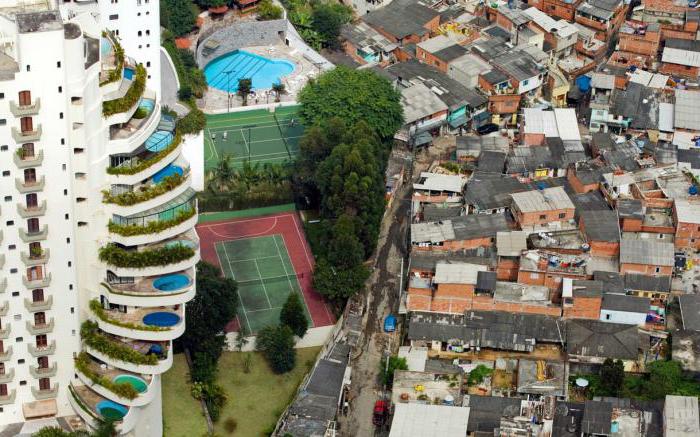
Wealth distribution
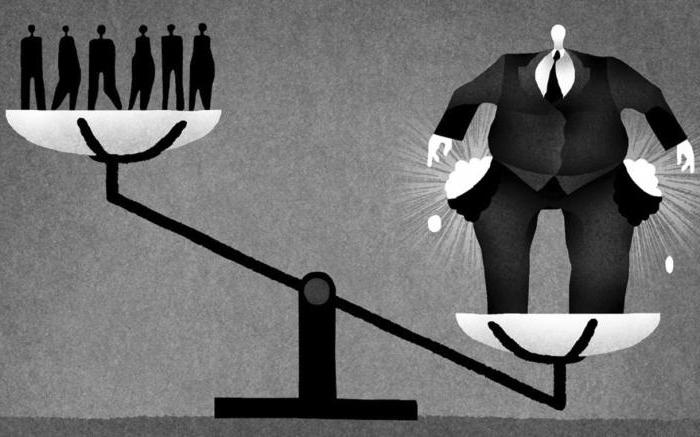
In any country there are rich and poor citizens. The first have the lion's share national wealth the second - barely making ends meet. In the short term, we observe an inequality in the distribution of income. In the long term - the injustice of the accumulation of wealth by the elites.
History of concept formation
There are two ways to measure income distribution inequality — the Lorentz curve and the Gini coefficient. Both concepts were developed at the beginning of the 20th century and bear the names of their creators. In 1905, Max Otto Lorenz published an article in the American statistical book, in which he described his calculation methodology. Corrado Gini developed his coefficient in 1914. But both works became famous after the publication of Tony Atkinson's work on poverty and income inequality. Since that time, more and more economists are turning to original concepts and formulating their methods on their basis.
Lorenz curve
Suppose we want to portray the injustice of the distribution of wealth in a state. For this we need incomes of the population. The Lorenz curve is built in four stages:
- On the ordinate axis, put aside the percentage of total wealth, abscissa - the proportion of the population.
- Divide the resulting graph into deciles. This allows us to answer the question of what income the poorest and richest 10% of the population have.
- To assume that we live in a completely fair society. In this case, all groups of the population would have the same income. The Lorentz curve would look like a straight line, which is 45 degrees with the abscissa axis.
- Compare our real schedule with the situation of a perfectly fair society.
The Lorentz curve allows you to visualize the inequality of the distribution of income. Several charts can be combined to show changes over time or to compare the situation in a number of countries.

How to build a Lorentz curve in practice
Suppose that in the industry we are considering there are ten firms that differ in their contribution to the economy. If we had population incomes, the Lorentz curve would show the inequality of their distribution. In this case, it illustrates the fairness of the division of the market. In order to construct the Lorentz curve, in this case it is necessary:
- Draw the abscissa and ordinate axis and name them correctly.
- Draw a line of absolute equality.
- To postpone the release of each of the firms.
- Analyze the resulting graph.
- Answer the question: "What triggers income inequality?" The Lorentz curve in this particular case shows the injustice of the division of the market.

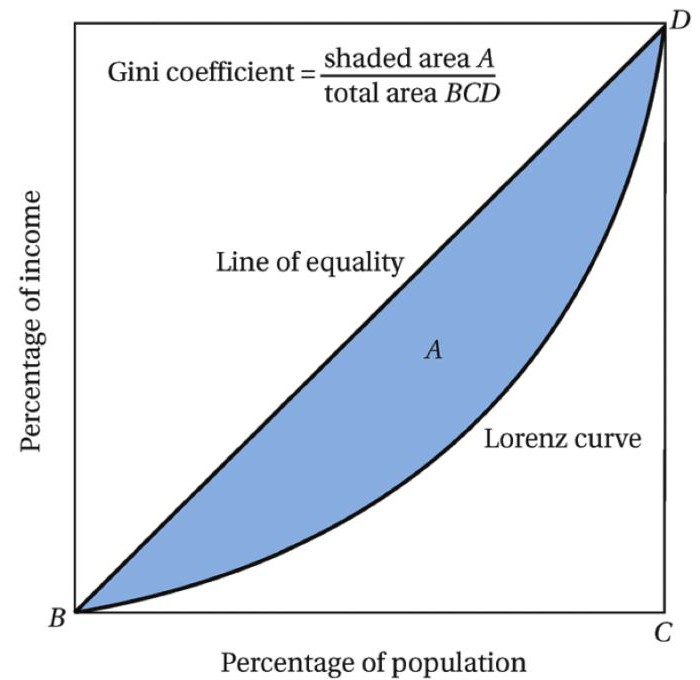
Gini coefficient
We examined the features of constructing a revenue distribution graph. The Lorentz curve is responsible for the visual side of the question. The Gini coefficient operates with numerical values. It is measured by the ratio of points on a real graph with an ideal case (a straight line that forms an angle of 45 degrees with the abscissa axis). Gini coefficient can take values from 0 to 1.In the first case, we are dealing with the absolute justice of the distribution of incomes, in the second - with complete inequality, when one person has all the national wealth, and nothing remains for the other. Naturally, both cases are unrealistic. However, it is important to understand that a lower value of the coefficient indicates a better situation in the state economy.
Coefficient Use Issues
The Gini Index is fully based on gross domestic product and population income statistics. Many developing countries do not provide accurate information, which does not correctly assess the situation with the distribution of wealth in them. There is also an inverse proportion between the Gini coefficient and per capita gross domestic product. This is because in poorer countries the problems are more significant.
Interpretation of indicators
When we figured out how to construct the Lorentz curve, it is important to understand what it really means. How can countries be compared with different levels of GDP? The Lorentz curve and the Gini coefficient are used to understand how equitably the national wealth of the state is distributed. It must be understood that the states with the lowest rates are not necessarily the richest countries. Similar gross products do not indicate the same curve in the income distribution graph.
Depth of poverty
Inequality in the distribution of income leads to the fact that 10% of the population comes off to the full, and the lower decile is forced to survive by $ 1.25 per day. All who earn less than this amount are generally considered living below the poverty line. However, you need to understand that each country has its own price of life, so this standard must be adjusted for national characteristics.
The World Bank Development Study Group calculates a special measure of the depth of poverty. To do this, household income and consumption indicators of 115 countries are used. Reports on the indicator are issued twice a year: in April and September.
State social policy
A high degree of uneven distribution of income is the cause of strikes and even revolutions. Therefore, the goal of any government is to make this phenomenon less visible and narrow the gap between rich and poor. The social policy of the state is usually associated with the development of fair relations in society, the formation of protective mechanisms and the creation of conditions for the growth of the welfare of the population. To do this, the government has to solve the following tasks:
- Prepare and implement employment programs.
- To provide assistance to socially vulnerable groups of the population.
- Ensure the accessibility of cultural property.
- Develop and implement educational and medical programs.
findings
An ideal society of absolute justice does not exist. There are only states with a larger or smaller Gini coefficient. The smaller the gap between the ideal and the real Lorentz curve, the better the income is distributed in the country. The problem of the injustice of wealth accumulation by individuals or groups is characteristic of many modern states, especially developing ones. A partial solution to this problem requires a competent national social policy. Its effectiveness is evaluated by comparing the level and quality of life in different countries or for a certain period. It is important to prevent the achievement of the so-called social bottom and the progression of disproportionality. If the state copes with its functions, then the population, even the poor, should feel an improvement in living standards. And this is connected not only with a change in the shape of the Lorentz curve, but with the extension consumer basket. Otherwise, a coup with all its negative consequences is beginning to brew in society.
