The state exists primarily for people. Therefore, the main task of management should be to address the issue of improvement living standards and the welfare of each individual. And for this, you first need to analyze the distribution of material wealth between different social strata. One of the indicators that allow this to be done is the decile income differentiation coefficient. It is on its basis that they often make up the welfare structure of the population.
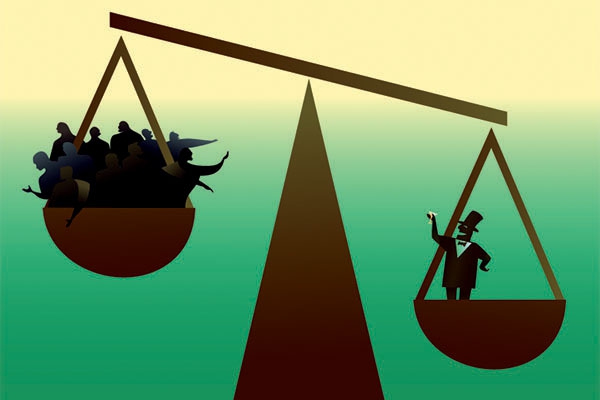
Graph of social inequality
Difference in total income different strata of the population, economists calculate using a range of indicators. Among them, the main ones are the Gini index and the decile coefficient of differentiation. Graphically, social inequality is displayed using the Lorentz curve. The degree of inequality characterizes the angle of deviation of the broken line from the bisector. If incomes are equal, then the Lorentz curve completely coincides with it. This situation means that any 10% of the population has a similar percentage of the total national material resources. If someone alone appropriated all the income, then Lorentz curve will first go along the abscissa, and then rise vertically. According to the graph, you can calculate the Gini index.
Decile income differentiation ratio
The distribution of material resources between representatives of various social classes within a country without constructing a graph in sociology is measured using a number of tools. The decile ratio is one of them. It is the ratio middle income 10% of the richest residents of the state to the same percentage of the poorest. The smaller the result, the more stable the situation in society. It is believed that a coefficient greater than 10 means a hypothetical possibility of civil unrest and the onset of a coup. This is due to the fact that the difference in assets belonging to different "castes" is so great that the injustice of the structure of society is immediately evident.
Decile ratio calculation
Analysis of social stratification begins with the division of the population into groups. This can be done either using statistical programs or manually. To do this, collect level information population income and then arrange it in descending order. You should get ten groups. The first will include the richest residents, the tenth - low-income citizens. The decile coefficient will be equal to the ratio of the average income of the last group to the income of the wealthiest. To facilitate memorization, you can make a mathematical formula, designating all the components with letters. Let d1 and d10 Is the income of 10% of the richest and poorest people, and Kd - decile coefficient. In this case, the formula will look like this: Kd = K10 / K1.

The practical value of the indicator
The decile income differentiation coefficient shows the differences between the incomes of the richest and least wealthy segments of the population. He points to the concentration of income in one hand. If the value of this coefficient is ten, then this means that the richest group receives 10 times more profit than a similar poor one. Thus, the decile coefficient shows the difference between different segments of the population and is a tool of economic analysis.It is on the basis of the calculation of such indicators that competent public administration should be formed.
The value of the indicator in the countries of the world
Consider the countries of the world in terms of income inequality between rich and poor based on data from the UN and the CIA. Europe has the lowest value in Denmark, Sweden and Finland. In these countries, the incomes of the rich and the poor differ by 3 times. In countries such as Germany and France, this figure is three times higher on average. At the same time, programs aimed at reducing social tension are being implemented in these countries; therefore, income inequality tends to decrease. The highest rates are in Namibia, Bolivia, Sierra Leone, Honduras, Haiti, Botswana and Brazil (75 on average).
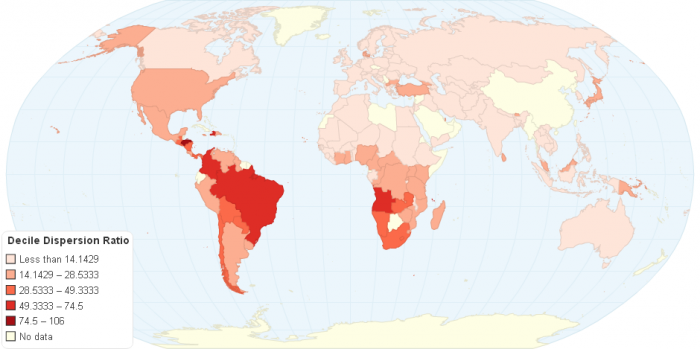
The generalized decile coefficient in the countries of the European Union is 6 (the lowest - in the Scandinavian countries - about 4), in the USA - 15, in Japan - 6, in North Africa - 6.
Decile ratio in Russia
The situation with injustice in the distribution of income is a notorious situation in our society. Since the 90s of the last century, the decile coefficient in the Russian Federation is only growing. The gap between social groups has reached such proportions that the problem is visible to the naked eye. And what justice can we talk about in this case? The richest 10% have 20 times greater tangible assets than a similar-sized group of the poor. However, the situation was not always so sad.
At the beginning of the last century, the decile coefficient did not exceed 6, while in the USA it did not exceed 18. By the standards of Western countries, even the royal family lived poorly. This once again proves that the Bolshevik revolution of 1917 was caused by political reasons, not economic ones. It is believed that any unrest may occur if the indicator exceeds 10.

Social differentiation in tsarist Russia
According to a study by Professor B. Mironov, the poorest segments of the population in 1901-1904. The following categories of people belonged:
- Marginals.
- Farm workers.
- The day laborers.
- Women and children employed in factories.
The income of the poorest 10% of the population was 6.5 rubles per month, or about 78 per year.
Assessment of the wealthiest people in the country was handled by the Income Tax Commission, established under the Ministry of Finance in 1905. She estimated that on average their income was 2130 rubles per year, or 178 per month. But this is only 1% of the tenth group. The remaining 9% of the rich received only 320.5 rubles a year. Thus, the average income of the tenth decile group is 493 rubles, and the coefficient of differentiation is 6.3.
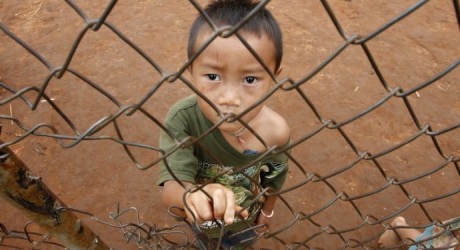
Threats of uneven distribution
Low-income families are the most vulnerable layer of the population. They do not have enough savings to survive cyclical economic crises. The presence of such population groups not only provokes conflicts and unrest, but also forces the state to spend considerable funds on their maintenance. Moreover, subsidizing is not a solution to the problem, but only delays the escalation of the situation. A much more rational way is to create new jobs and introduce progressive taxation.
