Correlation Regression Analysis - This is one of the most common methods for studying the relationship between numerical values. Its main goal is to find the relationship between the two parameters and its degree with the subsequent derivation of the equation. For example, we have students who have passed the math and English exam. We can use correlation to determine whether the success of one test affects the results in another subject. Regarding regression analysis, it helps to predict math grades based on the points scored in an English exam, and vice versa.
What is a correlation chart?
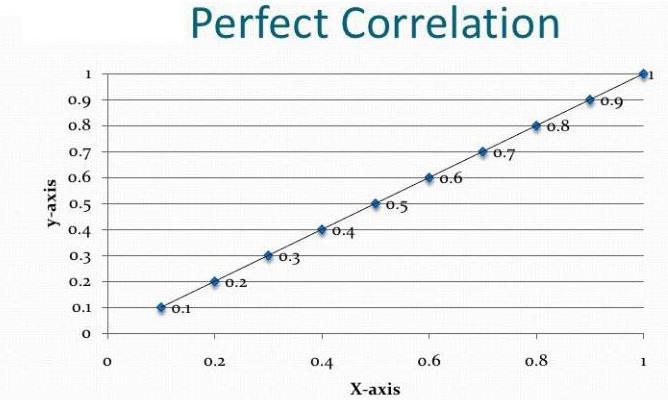
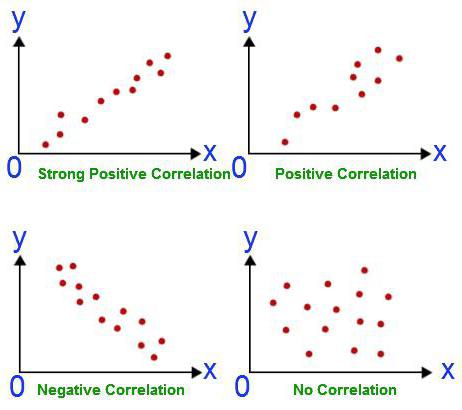
Any analysis begins with the collection of information. The more it is, the more accurately the result obtained in the end. In the above example, we have two disciplines in which students need to pass an exam. Their success rate is an estimate. Correlation-regression analysis shows whether the result of one subject affects the points scored in the second exam. In order to answer this question, it is necessary to analyze the ratings of all students in parallel. But first you need to decide on the dependent variable. In this case, it is not so important. Suppose a math exam took place earlier. Points on it are an independent variable (they are postponed along the abscissa). English is on the schedule later. Therefore, estimates based on it are a dependent variable (are plotted along the ordinate). The more the graph thus obtained looks like a straight line, the stronger the linear correlation between the two selected values. This means that students in mathematics are more likely to get fives in the English exam.
Assumptions and Simplifications
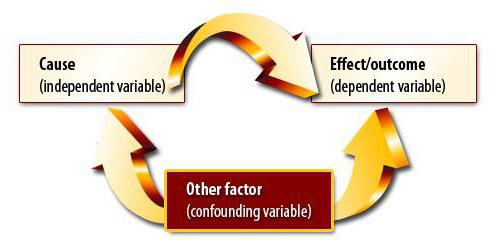
The method of correlation and regression analysis involves finding a causal relationship. However, at the first stage, you need to understand that changes in both quantities can be due to some third, not yet taken into account by the researcher. There can also be non-linear relations between the variables, therefore, obtaining a coefficient equal to zero is not the end of the experiment.
Pearson linear correlation
This coefficient can be used subject to two conditions. The first - all values of the variables are rational numbers, the second - it is expected that the values change proportionally. This coefficient is always between -1 and 1. If it is greater than zero, then there is a directly proportional dependence, less - inversely, equal - these values do not affect one another in any way. The ability to calculate this indicator is the basis of correlation and regression analysis. For the first time, this coefficient was developed by Karl Pearson based on the idea of Francis Galton.
Properties and Cautions
Pearson's correlation coefficient is a powerful tool, but it should also be used with caution. The following warnings are in its use:
- The Pearson coefficient indicates the presence or absence of a linear relationship. Correlation-regression analysis does not end there, it may turn out that the variables are nevertheless interconnected.
- One must be careful in interpreting the coefficient value. A correlation can be found between leg size and IQ level.But this does not mean that one indicator determines another.
- The Pearson coefficient does not say anything about the causal relationship between the indicators.

Spearman's rank correlation coefficient
If a change in the value of one indicator leads to an increase or decrease in the value of another, then this means that they are related. Correlation-regression analysis, an example of which will be given below, is precisely connected with such parameters. Rank coefficient allows you to simplify the calculations.
Correlation and regression analysis: an example
Suppose that there is an assessment of the effectiveness of ten enterprises. We have two judges who give them points. The correlation and regression analysis of the enterprise in this case cannot be carried out on the basis of the linear Pearson coefficient. We are not interested in the relationship between judges' ratings. The ranks of the enterprises according to judges are important.
This type of analysis has the following advantages:
- Nonparametric form of relations between the studied quantities.
- Ease of use, because the ranks can be attributed both in ascending order of value and descending order.
The only requirement of this type of analysis is the need to convert the source data.
Application problems
The correlation and regression analysis is based on the following assumptions:
- Observations are considered independent (a five-fold loss of the “eagle” does not affect the result of the next coin flip).
- In the correlation analysis, both variables are considered random. In regression - only one (dependent).
- When testing a hypothesis, a normal distribution must be observed. The change in the dependent variable should be the same for each value on the abscissa.
- The correlation diagram is only the first test of the hypothesis about the relationship between the two series of parameters, and not the final result of the analysis.
Dependence and causation
Suppose we have calculated the correlation coefficient of export volume and GDP. It turned out to be equal to unity modulo. Have we done correlation and regression analysis to the end? Of course not. The result obtained does not mean at all that GDP can be expressed through export. We have not yet proven a causal relationship between indicators. Correlation-regression analysis - forecasting the values of one variable based on another. However, you need to understand that often a lot of factors affect the parameter. Export determines the GDP, but not only it. There are other factors. Here there is a correlation, and a causal relationship, albeit adjusted for other components of the gross domestic product.
Another situation is much more dangerous. In the UK, a survey was conducted that showed that children whose parents smoked were more often offenders. This conclusion is based on a strong correlation between the indicator. But is he correct? Firstly, the dependence could be inverse. Parents could start smoking due to stress from the fact that their children constantly get into alterations and break the law. Secondly, both parameters may be due to the third. Such families belong to low social classes, which are characterized by both problems. Therefore, based on the correlation, it cannot be concluded that there is a causal relationship.
Why use regression analysis?
Correlation dependence involves finding relationships between quantities. The causal relationship in this case remains behind the scenes. The tasks of correlation and regression analysis coincide only in terms of confirming the existence of a relationship between the values of two quantities. However, initially the researcher does not pay attention to the possibility of a causal relationship. Regression analysis always has two variables, one of which is dependent. It takes place in several stages:
- Choosing the right model using the least squares method.
- Derivation of an equation describing the effect of a change in an independent variable on another.
For example, if we study the effect of age on human growth, then a regression analysis can help predict changes over the years.
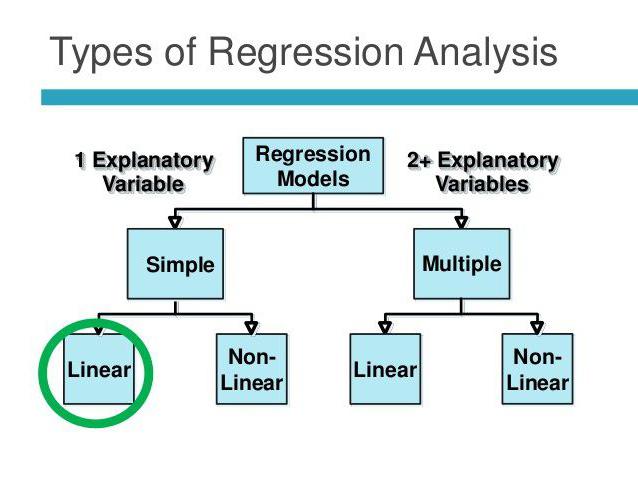
Linear and multiple regression
Suppose X and Y are two related variables. Regression analysis allows us to predict the magnitude of one of them based on the values of the other. For example, maturity and age are dependent symptoms. The relationship between them is reflected using linear regression. In fact, you can express X through Y or vice versa. But often only one of the regression lines is correct. The success of the analysis largely depends on the correct determination of the independent variable. For example, we have two indicators: yield and precipitation. From everyday experience, it becomes clear that the first depends on the second, and not vice versa.
Multiple regression allows you to calculate an unknown value based on the values of three or more variables. For example, rice yield per acre of land depends on grain quality, soil fertility, fertilizers, temperature, and rainfall. All of these parameters affect the overall result. To simplify the model, the following assumptions are used:
- The relationship between independent and influencing characteristics is linear.
- Multicollinearity is excluded. This means that dependent variables are not interconnected.
- Homoskedasticity and normality of series of numbers.
The use of correlation and regression analysis
There are three main cases of using this method:
- Testing casual relationships between quantities. In this case, the researcher determines the values of the variable and finds out whether they affect the change in the dependent variable. For example, you can give people different doses of alcohol and measure their blood pressure. In this case, the researcher knows for sure that the first is the cause of the second, and not vice versa. Correlation-regression analysis allows you to detect a directly proportional linear relationship between these two variables and derive a formula that describes it. In this case, values expressed in completely different units of measurement can be compared.
- Finding a relationship between two variables without extending a causal relationship to them. In this case, there is no difference what size the researcher calls dependent. Moreover, in reality, it may turn out that both of them are affected by the third variable, therefore they change proportionally.
- Calculation of the values of one quantity based on another. It is based on an equation in which known numbers are substituted.
Thus, correlation analysis involves finding a connection (not causal) between variables, and regression analysis explains it, often using a mathematical function.