In statistical modeling, regression analysis is a study used to assess the relationship between variables. This mathematical method includes many other methods for modeling and analyzing several variables, when the focus is on the relationship between the dependent variable and one or more independent ones. More specifically, regression analysis helps to understand how a typical value of a dependent variable changes if one of the independent variables changes, while the other independent variables remain fixed.

In all cases, the target estimate is a function of independent variables and is called the regression function. In regression analysis, it is also of interest to characterize the change in the dependent variable as a function of regression, which can be described using a probability distribution.
Regression Analysis Tasks
This statistical research method is widely used for forecasting, where its use has a significant advantage, but sometimes it can lead to illusions or false relationships, therefore it is recommended to carefully use it in this issue, because, for example, correlation does not mean a causal relationship.
A large number of methods have been developed for conducting regression analysis, such as linear and ordinary least squares regression, which are parametric. Their essence is that the regression function is defined in terms of a finite number of unknown parameters that are estimated from the data. Nonparametric regression allows its functions to lie in a certain set of functions, which can be infinite-dimensional.
As a statistical research method, the regression analysis in practice depends on the form of the data generation process and how it relates to the regression approach. Since the true form of the data process is generating, as a rule, an unknown number, the regression analysis of the data often depends to some extent on the assumptions about this process. These assumptions are sometimes verified if there is enough data available. Regression models are often useful even when assumptions are moderately violated, although they cannot work at maximum efficiency.
In a narrower sense, regression may relate specifically to the assessment of continuous response variables, in contrast to the discrete response variables used in the classification. The case of a continuous output variable is also called metric regression in order to distinguish it from related problems.
Story
The earliest form of regression is the well-known least squares method. It was published by Legendre in 1805 and Gauss in 1809. Legendre and Gauss applied the method to the task of determining from astronomical observations the orbits of bodies around the Sun (mainly comets, but later newly discovered minor planets). Gauss published a further development of the theory of least squares in 1821, including a version of the Gauss-Markov theorem.

The term “regression” was coined by Francis Galton in the 19th century to describe a biological phenomenon. The bottom line was that the growth of descendants from the growth of ancestors, as a rule, regresses down to the normal average.For Galton, regression had only this biological meaning, but later his work was continued by Udney Yule and Karl Pearson and brought to a more general statistical context. In the work of Yule and Pearson, the joint distribution of response variables and explanatory variables is considered Gaussian. This assumption was rejected by Fisher in the works of 1922 and 1925. Fisher suggested that the conditional distribution of the response variable is Gaussian, but the joint distribution should not be. In this regard, Fischer’s assumption is closer to the 1821 Gauss formulation. Until 1970, it sometimes took up to 24 hours to get the result of a regression analysis.
Regression analysis methods continue to be an area of active research. In recent decades, new methods have been developed for reliable regression; regression involving correlated responses; regression methods accommodating various types of missing data; nonparametric regression; Bayesian regression methods; regressions in which predictor variables are measured with an error; regressions with more predictors than observations, as well as causal inferences with regression.
Regression models
Regression analysis models include the following variables:
- Unknown parameters, designated as beta, which may be a scalar or vector.
- Independent Variables, X.
- Dependent Variables, Y.
In various fields of science where regression analysis is applied, various terms are used instead of dependent and independent variables, but in all cases the regression model relates Y to the functions X and β.
The approximation usually takes the form E (Y | X) = F (X, β). To conduct a regression analysis, the type of function f must be determined. Less commonly, it is based on knowledge of the relationship between Y and X that do not rely on data. If such knowledge is not available, then a flexible or convenient form F is chosen.
Dependent Variable Y
Now suppose that the vector of unknown parameters β has length k. To perform a regression analysis, the user must provide information about the dependent variable Y:
- If there are N data points of the form (Y, X), where N
- If exactly N = K is observed, and the function F is linear, then the equation Y = F (X, β) can be solved exactly, and not approximately. This reduces to solving a set of N-equations with N-unknowns (elements of β), which has a unique solution as long as X is linearly independent. If F is non-linear, the solution may not exist, or many solutions may exist.
- The most common is the situation where N> points to the data are observed. In this case, there is enough information in the data to evaluate the unique value for β that best matches the data, and the regression model, when applied to the data can be considered as an overdetermined system in β.
In the latter case, regression analysis provides tools for:
- Finding solutions for unknown parameters β, which will, for example, minimize the distance between the measured and predicted values of Y.
- Under certain statistical assumptions, regression analysis uses excess information to provide statistical information about unknown parameters β and the predicted values of the dependent variable Y.
Necessary number of independent measurements
Consider a regression model that has three unknown parameters: β0, β1 and β2. Suppose that the experimenter performs 10 measurements in the same value of the independent variable of the vector X.In this case, regression analysis does not provide a unique set of values. The best thing you can do is evaluate the mean and standard deviation of the dependent variable Y. By measuring two different X values in the same way, you can get enough data for a regression with two unknowns, but not for three or more unknowns.
If the experimenter's measurements were carried out at three different values of the independent variable of the vector X, then the regression analysis will provide a unique set of estimates for three unknown parameters in β.
In the case of general linear regression, the above statement is equivalent to the requirement that the matrix XTX is reversible.
Statistical Assumptions
When the number of measurements N is greater than the number of unknown parameters k and the measurement error εi, then, as a rule, the excess of information contained in the measurements is then distributed and used for statistical forecasts regarding unknown parameters. This excess of information is called the degree of freedom of regression.
Fundamental assumptions
Classic assumptions for regression analysis include:
- The sample is representative of inference prediction.
- The error is a random variable with an average value of zero, which is conditional on the explanatory variables.
- Independent variables are measured without error.
- As independent variables (predictors), they are linearly independent, that is, it is not possible to express any predictor in the form of a linear combination of the others.
- Errors are uncorrelated, i.e., the covariance matrix of diagonal errors and each nonzero element are the variance of the error.
- The variance of the error is constant according to the observations (homoskedasticity). If not, you can use the weighted least squares method or other methods.
These sufficient conditions for the least squares estimation possess the required properties, in particular, these assumptions mean that the parameter estimates will be objective, consistent and effective, especially when taken into account in the class of linear estimates. It is important to note that evidence rarely meets conditions. That is, the method is used even if the assumptions are not true. A variation of assumptions can sometimes be used as a measure of how useful this model is. Many of these assumptions can be mitigated by more advanced methods. Statistical analysis reports typically include analysis of tests based on sample data and methodology for model utility.
In addition, variables in some cases refer to values measured at point locations. There may be spatial trends and spatial autocorrelation in variables that violate statistical assumptions. Geographic weighted regression is the only method that deals with such data.
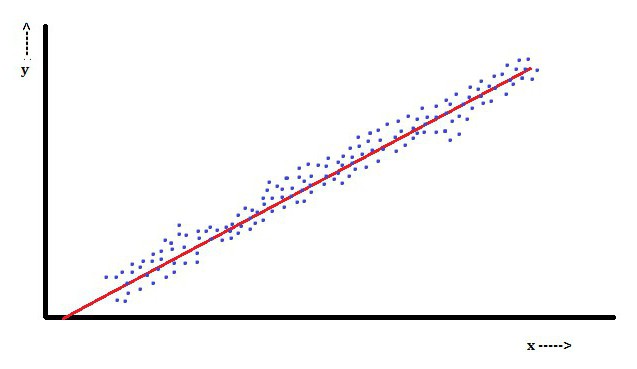
Linear Regression Analysis
In linear regression, a feature is that the dependent variable, which is Yiis a linear combination of parameters. For example, in a simple linear regression, one independent variable, x, is used to model n-pointsi, and two parameters, β0 and β1.
With multiple linear regression, there are several independent variables or their functions.
With random sampling from a population, its parameters make it possible to obtain a model of a linear regression model.
In this aspect, the least-squares method is the most popular. Using it, parameter estimates are obtained that minimize the sum of squared residuals. This kind of minimization (which is characteristic of a linear regression) of this function leads to a set of normal equations and a set of linear equations with parameters that are solved to obtain parameter estimates.
Under the further assumption that the error of the population usually spreads, the researcher can use these estimates of standard errors to create confidence intervals and test hypotheses about its parameters.
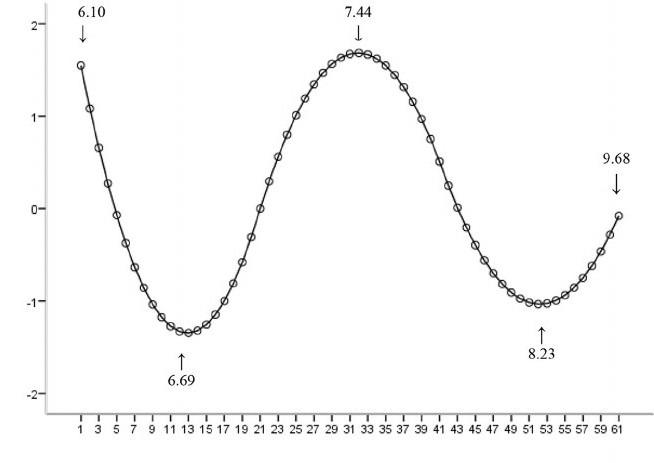
Nonlinear Regression Analysis
An example where the function is not linear with respect to the parameters indicates that the sum of the squares should be minimized using an iterative procedure. This introduces many complications that determine the differences between linear and non-linear least squares methods. Consequently, the results of regression analysis using the nonlinear method are sometimes unpredictable.
Calculation of power and sample size
Here, as a rule, there are no consistent methods regarding the number of observations compared to the number of independent variables in the model. The first rule was proposed by Good and Hardin and looks like N = t ^ n, where N is the sample size, n is the number of independent variables, and t is the number of observations necessary to achieve the desired accuracy if the model had only one independent variable. For example, a researcher builds a linear regression model using a dataset that contains 1000 patients (N). If the researcher decides that five observations are needed to accurately determine the line (m), then the maximum number of independent variables that the model can support is 4.
Other methods
Despite the fact that the parameters of the regression model are usually estimated using the least squares method, there are other methods that are used much less frequently. For example, these are the following methods:
- Bayesian methods (e.g. Bayesian linear regression method).
- Percent regression, used for situations where a reduction in percent errors is considered more appropriate.
- The smallest absolute deviations, which is more stable in the presence of outliers leading to quantile regression.
- Nonparametric regression, requiring a large number of observations and calculations.
- The distance of the learning metric, which is studied in search of a significant metric distance in a given input space.
Software
All major statistical software packages are performed using least squares regression analysis. Simple linear regression and multiple regression analysis can be used in some spreadsheet applications, as well as on some calculators. Although many statistical software packages can perform various types of nonparametric and reliable regression, these methods are less standardized; different software packages implement different methods. Specialized regression software has been developed for use in areas such as examination analysis and neuroimaging.