Analysis of variance is a set of statistical methods designed to test hypotheses about the relationship between certain signs and the factors being studied, which do not have a quantitative description, as well as to establish the degree of influence of factors and their interaction. In the specialized literature it is often called ANOVA (from the English name Analysis of Variations). This method was first developed by R. Fisher in 1925.
Types and criteria of analysis of variance
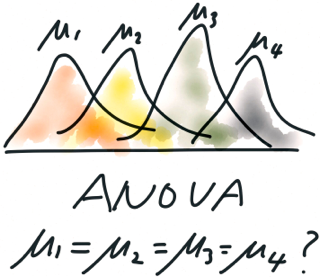
This method is used to study the relationship between qualitative (nominal) attributes and a quantitative (continuous) variable. In fact, he tests the hypothesis that the arithmetic mean of several samples is equal. Thus, it can be considered as a parametric criterion for comparing the centers of several samples at once. If you use this method for two samples, then the results of analysis of variance will be identical to the results of t-student test. However, unlike other criteria, this study allows us to study the problem in more detail.

Analysis of variance in statistics is based on the law: the sum of the squares of the deviations of the combined sample is equal to the sum of the squares of the intragroup deviations and the sum of the squares of the intergroup deviations. For the study, the Fisher test is used to establish the significance of the difference between intergroup variances from intragroup variances. However, for this, the necessary prerequisites are the normal distribution and homoskedasticity (equality of variances) of the samples. Distinguish between one-dimensional (univariate) variance analysis and multivariate (multivariate). The first one considers the dependence of the studied quantity on one attribute, the second - immediately on many, and also reveals the relationship between them.
Factors
Factors are called controlled circumstances that affect the end result. Its level or method of processing is called the value that characterizes the specific manifestation of this condition. These numbers are usually given in a nominal or serial scale. Often, output values are measured in quantitative or ordinal scales. Then the problem arises of grouping the output data in a series of observations, which correspond to approximately the same numerical values. If the number of groups is taken to be excessively large, then the number of observations in them may be insufficient to obtain reliable results. If you take the number too small, this can lead to the loss of significant features of the impact on the system. The specific way data is grouped depends on the volume and nature of the variation in the values. The number and size of intervals in one-way analysis is most often determined by the principle of equal intervals or by the principle of equal frequencies.
Analysis of variance problems
So, there are cases when you need to compare two or more samples. It is then that the use of analysis of variance is advisable. The name of the method indicates that conclusions are drawn from the study of the components of the variance. The essence of the study is that the general change in the indicator is divided into component parts that correspond to the action of each individual factor. Consider a number of problems that a typical analysis of variance solves.
Example 1
The workshop has a number of machine tools - automatic machines that produce a specific part. The size of each part is a random value, which depends on the settings of each machine and random deviations that occur during the manufacturing of parts.It is necessary to determine whether the machines are equally configured according to the measurements of the dimensions of the parts.
Example 2
During the manufacture of the electric apparatus, various types of insulating paper are used: condenser, electrical, etc. The apparatus can be impregnated with various substances: epoxy resin, varnish, ML-2 resin, etc. Leaks can be eliminated under vacuum at high pressure, by heating. It can be impregnated by immersion in varnish, under a continuous stream of varnish, etc. The electrical apparatus as a whole is poured with a certain compound, of which there are several options. Quality indicators are the dielectric strength of the insulation, the temperature of the overheating of the winding in operating mode, and a number of others. During testing the technological process of manufacturing apparatuses, it is necessary to determine how each of the listed factors affects the performance of the apparatus.
Example 3
The trolleybus depot serves several trolleybus routes. Various types of trolleybuses work for them, and fare collection is collected by 125 controllers. The depot management is interested in the question: how to compare the economic performance of each controller (revenue) taking into account different routes, different types of trolley buses? How to determine the economic feasibility of releasing a particular type of trolleybus on a particular route? How to establish reasonable requirements for the amount of revenue that the conductor brings on each route in different types of trolley buses?
The task of choosing a method is how to get the maximum information regarding the impact on the final result of each factor, to determine the numerical characteristics of such an effect, their reliability at the lowest cost and in the shortest possible time. Solve such problems allow methods of analysis of variance.
One-way analysis
The study aims to assess the magnitude of the impact of a particular case on the analyzed review. Another task of one-way analysis may be to compare two or more circumstances with each other in order to determine the difference in their effect on the recall. If the null hypothesis is rejected, then the next step will be the quantitative assessment and construction of confidence intervals for the obtained characteristics. In the case when null hypothesis cannot be discarded, it is usually accepted and a conclusion is drawn on the essence of influence.
Univariate analysis of variance can become a nonparametric analogue of the Kraskel-Wallis rank method. It was developed by American mathematician William Kraskel and economist Wilson Wallis in 1952. This criterion was assigned to test the null hypothesis that the effects on the studied samples are equal with unknown but equal average values. The number of samples should be more than two.

The Jonkhier criterion (Jonkhier-Terpstra) was proposed independently by the Dutch mathematician T.J. Terpstrom in 1952 and the British psychologist E.R. Jonkhier in 1954. It is used when it is known in advance that the available groups of results are ordered by the growth of the influence of the studied factor, which is measured in an ordinal scale.
M - the Bartlett test, proposed by the British statistician Maurice Stevenson Bartlett in 1937, is used to test the null hypothesis about the equality of variances of several normal general populations from which the studied samples were taken, generally having different volumes (the number of each sample should be at least four )
G is the Cochren test, which was discovered by the American William Gemmel Cochren in 1941. It is used to test the null hypothesis that the variances of normal general populations are equal for independent samples of equal volume.
The nonparametric Levene criterion, proposed by the American mathematician Howard Levene in 1960, is an alternative to the Bartlett criterion in conditions where there is no certainty that the studied samples obey the normal distribution.
In 1974, American statisticians Morton B. Brown and Alan B. Forsyth proposed a test (Brown-Forsythe criterion), which is somewhat different from the Leuven criterion.
Two-factor analysis
Two-way analysis of variance is used for coupled normally distributed samples. In practice, complex tables of this method are often used, in particular those in which each cell contains a set of data (repeated measurements) corresponding to fixed level values. If the assumptions necessary for applying two-way analysis of variance are not fulfilled, then the nonparametric Friedman rank criterion (Friedman, Kendall, and Smith) developed by the American economist Milton Friedman at the end of 1930 is used. This criterion is independent of the type of distribution.
It is only assumed that the distribution of quantities is the same and continuous, and they are independent of one another. When testing the null hypothesis, the output is presented in the form of a rectangular matrix in which the rows correspond to the levels of factor B and the columns correspond to levels of A. Each cell of the table (block) can be the result of measurements of parameters on one object or on a group of objects at constant values of the levels of both factors . In this case, the corresponding data is supplied as the average values of a certain parameter for all measurements or objects of the studied sample. To apply the criterion of the output data, it is necessary to switch from the direct measurement results to their rank. The ranking is carried out for each row separately, that is, the values are ordered for each fixed value.

Page criterion (L-criterion), proposed by the American statistician E. B. Page in 1963, is intended to test the null hypothesis. For large samples, the Page approximation is used. They, subject to the reality of the corresponding null hypotheses, obey the standard normal distribution. In the case when the rows of the source table have the same values, it is necessary to use average ranks. Moreover, the accuracy of the conclusions will be the worse, the more there will be numbers of such coincidences.
Q is the Cochren criterion proposed by V. Cohren in 1937. It is used in cases where groups of homogeneous subjects are exposed to more than two and for which two responses are possible - conditionally negative (0) and conditionally positive (1) . The null hypothesis consists of equal effects of influence. Two-way analysis of variance makes it possible to determine the existence of processing effects, but does not make it possible to establish for which columns this effect exists. To solve this problem, the method of multiple Sheffe equations for coupled samples is used.
Multivariate analysis
The task of multivariate analysis of variance arises when it is necessary to determine the influence of two or more conditions on a certain random variable. The study provides for the presence of one dependent random variable, measured on the scale of difference or relations, and several independent variables, each of which is expressed in the scale of names or in rank. Analysis of variance data is a fairly developed section of mathematical statistics, which has a lot of options. The research concept is common for both single-factor and multi-factor. Its essence is that the total variance is divided into components, which corresponds to a certain data grouping. Each data grouping has its own model.Here we will consider only the basic provisions necessary for understanding and practical use of its most widely used options.
Analysis of variance of factors requires a rather careful attitude to the collection and presentation of input data, and especially to the interpretation of the results. Unlike one-factor, the results of which can be arbitrarily placed in a certain sequence, the two-factor results require a more complex representation. An even more difficult situation arises when there are three, four or more circumstances. Because of this, more than three (four) conditions are rarely included in a model. An example is the occurrence of resonance at a certain value of the capacitance and inductance of the electric circle; the manifestation of a chemical reaction with a certain set of elements from which the system is built; the occurrence of anomalous effects in complex systems with a certain coincidence of circumstances. The presence of interaction can fundamentally change the model of the system and sometimes lead to a rethinking of the nature of the phenomena with which the experimenter is dealing.
Multivariate analysis of variance with repeated experiments
Measurement data can often be grouped not by two, but by a larger number of factors. So, if we consider the analysis of variance of the service life of the tires of the trolley bus wheels taking into account the circumstances (the manufacturer and the route on which the tires are operated), then we can distinguish the season during which the tires are operated (namely, winter and summer operation) as a separate condition. As a result, we will have the task of a three-factor method.
If there are more conditions, the approach is the same as in the two-factor analysis. In all cases, they try to simplify the model. The phenomenon of the interaction of two factors is not so often manifested, and triple interaction occurs only in exceptional cases. They include the interaction for which there is previous information and good reasons to take it into account in the model. The process of isolating individual factors and taking them into account is relatively simple. Therefore, often there is a desire to highlight more circumstances. This should not be carried away. The more conditions, the less reliable the model becomes and the greater the probability of error. The model itself, which includes a large number of independent variables, becomes difficult enough to interpret and inconvenient for practical use.
The general idea of analysis of variance
Analysis of variance in statistics is a method of obtaining the results of observations that are dependent on various simultaneously existing circumstances, and assess their impact. A controlled variable that corresponds to the method of influencing the object of study and in a certain period of time acquires a certain value is called a factor. They can be qualitative and quantitative. Levels of quantitative conditions acquire a certain value on a numerical scale. Examples are temperature, pressure, amount of substance. Qualitative factors are different substances, different technological methods, devices, fillers. Their levels correspond to the scale of names.
The quality can also include the type of packaging material, storage conditions of the dosage form. It is also rational to attribute the degree of grinding of raw materials, the fractional composition of granules that are of quantitative importance, but are difficult to control if a quantitative scale is used. The number of quality factors depends on the type of dosage form, as well as the physical and technological properties of the medicinal substances. For example, tablets can be obtained from crystalline substances by direct compression. In this case, it is enough to make a choice of sliding and lubricating substances.
Examples of qualitative factors for various types of dosage forms
- Tinctures. The composition of the extractant, the type of extractor, the method of preparation of raw materials, the production method, the filtering method.
- Extracts (liquid, thick, dry). The composition of the extractant, the extraction method, the type of installation, the method of removing the extractant and ballast substances.
- Pills. The composition of excipients, fillers, disintegrants, binders, lubricants and glidants. A method of producing tablets, type of processing equipment. Type of shell and its components, film formers, pigments, dyes, plasticizers, solvents.
- Injection solutions. Type of solvent, filtration method, nature of stabilizers and preservatives, sterilization conditions, method for filling ampoules.
- Suppositories. The composition of the suppository base, a method of producing suppositories, fillers, packaging.
- Ointments. The composition of the base, structural components, the method of preparation of the ointment, the type of equipment, packaging.
- Capsules Type of shell material, method for producing capsules, type of plasticizer, preservative, dye.
- Liniment. The method of preparation, composition, type of equipment, type of emulsifier.
- Suspensions Type of solvent, type of stabilizer, dispersion method.
Examples of qualitative factors and their levels studied in the manufacturing process of tablets
- Baking powder. Potato starch, white clay, a mixture of sodium bicarbonate with citric acid, basic magnesium carbonate.
- Binding solution. Water, starch paste, sugar syrup, methyl cellulose solution, hydroxypropyl methyl cellulose solution, polyvinyl pyrrolidone solution, polyvinyl alcohol solution.
- Gliding substance. Aerosil, starch, talc.
- Filler. Sugar, glucose, lactose, sodium chloride, calcium phosphate.
- Lubricant. Stearic acid, polyethylene glycol, paraffin.
Analysis of variance models in the study of state competitiveness
One of the most important criteria for assessing the state of the state, which assesses the level of its well-being and socio-economic development, is competitiveness, that is, a set of properties inherent in the national economy, which determine the ability of the state to compete with other countries. Having determined the place and role of the state in the global market, we can establish a clear strategy for ensuring economic security internationally, because it is the key to positive relations between Russia and all the players in the world market: investors, creditors, state governments.
To compare the level of competitiveness of countries, countries are ranked using complex indices, which include various weighted indicators. The basis of these indices is the key factors affecting the economic, political, etc. situation. A set of models for studying the competitiveness of the state provides for the use of multivariate statistical analysis methods (in particular, analysis of variance (statistics), econometric modeling, decision making) and includes the following main steps:
- Formation of a system of indicators-indicators.
- Assessment and forecasting of indicators of state competitiveness.
- Comparison of indicators-indicators of the competitiveness of states.
Now consider the content of the models of each of the stages of this complex.
At the first stage With the help of expert study methods, a justified set of economic indicators-indicators of assessing the competitiveness of the state is formed taking into account the specifics of its development based on international ratings and data from statistical departments that reflect the state of the system as a whole and its processes.The choice of these indicators is justified by the need to select those that most fully from the point of view of practice make it possible to determine the level of the state, its investment attractiveness and the possibilities of relative localization of existing potential and real-life threats.

The main indicators-indicators of international rating systems are the indices:
- Global Competitiveness (IGC).
- Economic Freedom (IES).
- Human Development (HDI).
- Perceptions of Corruption (CPI).
- Internal and external threats.
- The potential of international influence (IPMV).
Second phase It provides for the assessment and forecasting of indicators of state competitiveness according to international ratings for the studied 139 countries of the world.
Third stage provides a comparison of the conditions of competitiveness of states using methods correlation and regression analysis.
Using the results of the study, it is possible to determine the nature of the processes as a whole and by individual components of the competitiveness of the state; test the hypothesis of the influence of factors and their relationship with appropriate significance level.
The implementation of the proposed set of models will allow not only to assess the current situation of the level of competitiveness and investment attractiveness of states, but also to analyze the weaknesses of management, prevent errors of incorrect decisions, and prevent the development of a crisis in the state.