The significance level in statistics is an important indicator reflecting the degree of confidence in the accuracy and truth of the received (predicted) data. The concept is widely used in various fields: from conducting sociological research to statistical testing of scientific hypotheses.

Definition
The level of statistical significance (or statistically significant result) shows what is the probability of an accidental occurrence of the studied indicators. The general statistical significance of the phenomenon is expressed by the coefficient p-value (p-level). In any experiment or observation, it is likely that the data obtained is due to sampling errors. This is especially true for sociology.
That is, a statistic is statistically significant whose probability of accidental occurrence is extremely small or tends to extremes. Extreme in this context is considered the degree of deviation of statistics from the null hypothesis (a hypothesis that is checked for consistency with the obtained sample data). In scientific practice, the significance level is chosen before data collection and, as a rule, its coefficient is 0.05 (5%). For systems where accurate values are extremely important, this indicator can be 0.01 (1%) or less.

Background
The concept of significance level was introduced by British statistician and geneticist Ronald Fisher in 1925 when he developed a methodology for testing statistical hypotheses. When analyzing a process, there is a certain probability of certain phenomena. Difficulties arise when working with small (or not obvious) percent probabilities that fall under the concept of "measurement error."
When working with statistics that are not specific enough to verify, scientists were faced with the problem of the null hypothesis, which “interferes” with small quantities. Fisher suggested defining for such systems probability of events 5% (0.05) as a convenient selective slice, allowing you to reject the null hypothesis in the calculations.
The introduction of a fixed coefficient
In 1933, scientists Jerzy Neumann and Egon Pearson in their works recommended in advance (before data collection) to establish a certain level of significance. Examples of the use of these rules are clearly visible during the election. Suppose there are two candidates, one of which is very popular, and the second is little known. Obviously, the first candidate wins the election, and the chances of the second tend to zero. They strive - but not equal: there is always the probability of force majeure, sensational information, unexpected decisions that can change the predicted election results.
Neumann and Pearson agreed that Fisher's proposed significance level of 0.05 (denoted by the symbol α) is most convenient. However, Fisher himself in 1956 opposed the fixation of this value. He believed that the level of α should be established in accordance with specific circumstances. For example, in particle physics it is 0.01.
P-value
The term p-value was first used in Brownley's work in 1960. P-level (p-value) is an indicator that is inversely related to the truth of the results. The highest coefficient p-value corresponds to the lowest level of confidence in the sample of dependence between the variables.
This value reflects the probability of errors associated with the interpretation of the results. Suppose p-level = 0.05 (1/20). It shows the five percent probability that the relationship between the variables found in the sample is just a random feature of the sample.That is, if this dependence is absent, then with repeated such experiments, on average, in every twentieth study, one can expect the same or greater dependence between the variables. Often, the p-level is considered as the “acceptable margin” of the error level.
By the way, p-value may not reflect the real relationship between the variables, but only shows a certain average value within the assumptions. In particular, the final analysis of the data will also depend on the selected values of this coefficient. With a p-level = 0.05, there will be some results, and with a coefficient of 0.01, others.
Testing statistical hypotheses
The level of statistical significance is especially important when testing hypotheses. For example, when calculating a two-sided test, the rejection area is divided equally at both ends of the sample distribution (relative to the zero coordinate) and the truth of the data is calculated.
Suppose, when monitoring a certain process (phenomenon), it turned out that the new statistical information indicates small changes relative to previous values. Moreover, the discrepancies in the results are small, not obvious, but important for the study. The dilemma arises before the specialist: are changes really taking place or are these sampling errors (inaccurate measurements)?
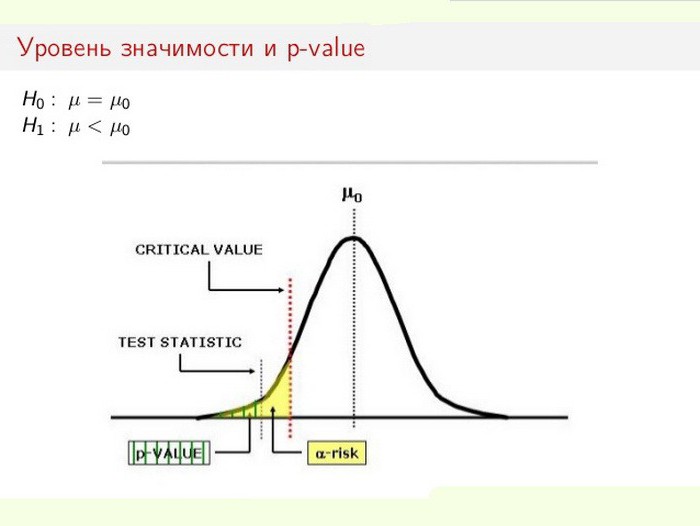
In this case, the null hypothesis is either used or rejected (all is attributed to an error, or the change in the system is recognized as a fait accompli). The process of solving the problem is based on the ratio of total statistical significance (p-value) and significance level (α). If the p-level <α, then the null hypothesis is rejected. The smaller the p-value, the more significant is the test statistic.
Values Used
The level of significance depends on the material being analyzed. In practice, the following fixed values are used:
- α = 0.1 (or 10%);
- α = 0.05 (or 5%);
- α = 0.01 (or 1%);
- α = 0.001 (or 0.1%).
The more accurate the calculations are required, the lower the coefficient α is used. Naturally, statistical forecasts in physics, chemistry, pharmaceuticals, genetics require greater accuracy than in political science, sociology.

Thresholds of relevance in specific areas
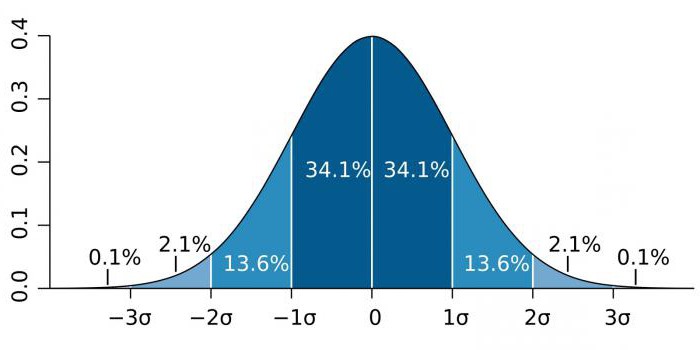
In high-precision areas, such as particle physics and manufacturing activities, statistical significance is often expressed as the ratio of the standard deviation (denoted by the sigma coefficient - σ) relative to the normal probability distribution (Gaussian distribution). σ is a statistical indicator that determines the dispersion of values of a certain value relative to mathematical expectations. Used to plot the probability of events.
Depending on the field of knowledge, the coefficient σ varies greatly. For example, when predicting the existence of the Higgs boson, the parameter σ is five (σ = 5), which corresponds to the value p-value = 1 / 3.5 million. In studies of genomes, the significance level can be 5 × 10⁻⁸that are not uncommon for this area.
Efficiency
Keep in mind that the coefficients α and p-value are not accurate characteristics. Whatever the significance level in the statistics of the studied phenomenon, it is not an unconditional basis for accepting the hypothesis. For example, the smaller the value of α, the greater the chance that the established hypothesis is significant. However, there is a risk of error, which reduces the statistical power (significance) of the study.
Researchers who focus solely on statistically significant results may get erroneous conclusions. At the same time, it is difficult to double-check their work, since they use assumptions (which, in fact, are the values of α and p-value). Therefore, it is always recommended, along with the calculation of statistical significance, to determine another indicator - the magnitude of the statistical effect. The magnitude of an effect is a quantitative measure of the strength of an effect.